
Image
|
Figure Caption
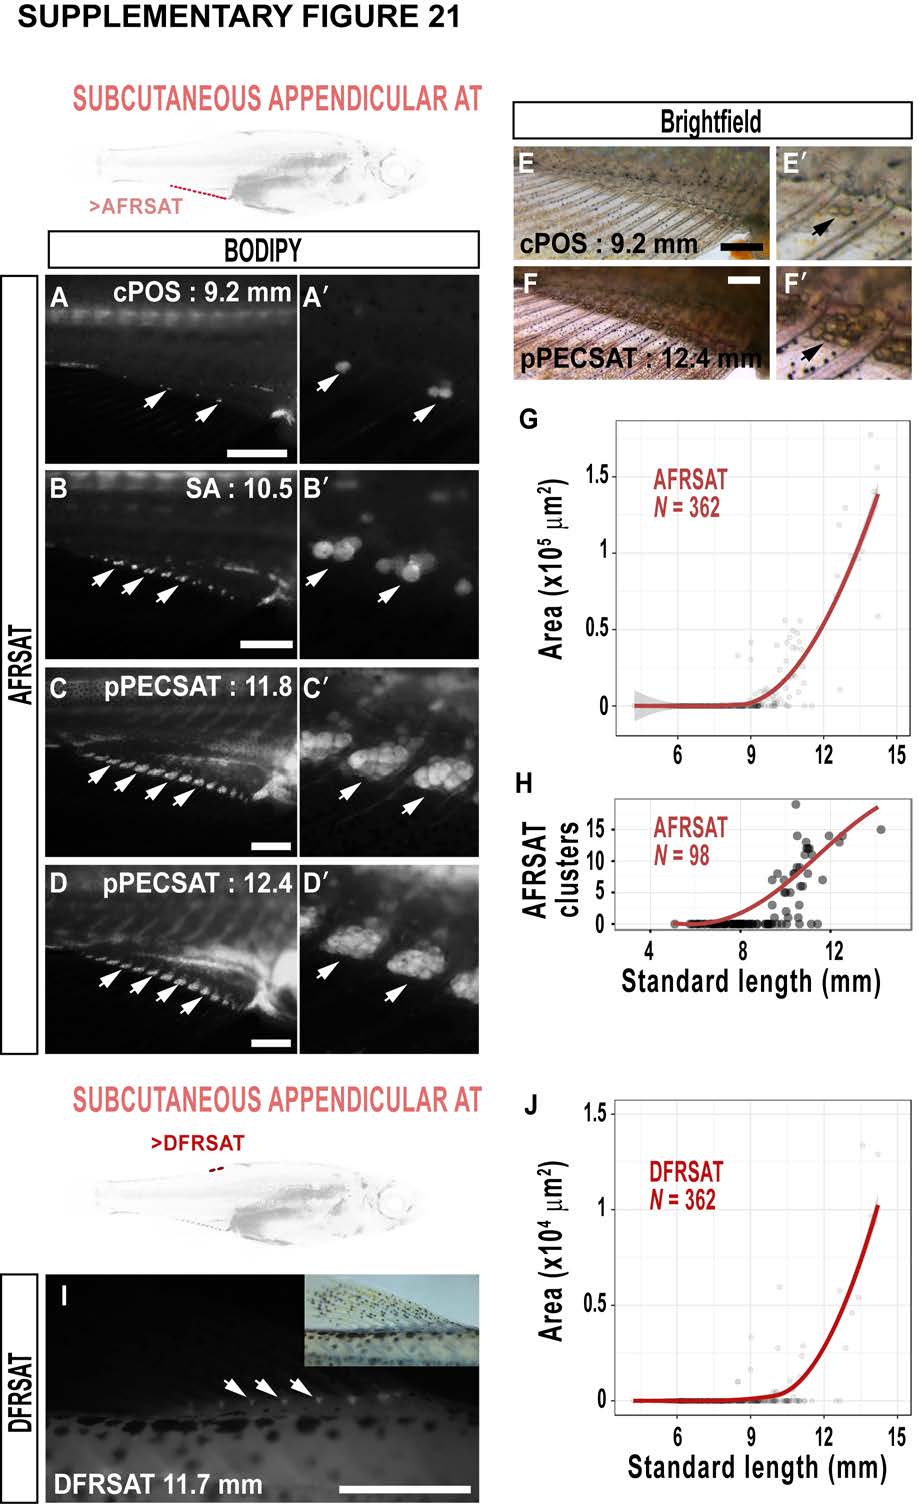
Fig. S21
The development of ATs at the anal (AFRSAT) and dorsal (DFRSAT) fin rays. A-D'. BODIPY timeseries of AFRSAT development. A'-D' are magnified images of A-D. Arrows indicate AFRSAT clusters. E-F'. Brightfield images of AFRSAT (arrows). G. Relationship between AFRSAT area and SL. H. Number of AFRSAT clusters. I. Brightfield (inset) and BODIPY images of DFRSAT (arrows). J. DFRSAT relative to SL. Scale bars are 500 μm. Fitted lines were generated by a LOESS function.
Acknowledgments
This image is the copyrighted work of the attributed author or publisher, and
ZFIN has permission only to display this image to its users.
Additional permissions should be obtained from the applicable author or publisher of the image.
Full text @ Dis. Model. Mech.