
|
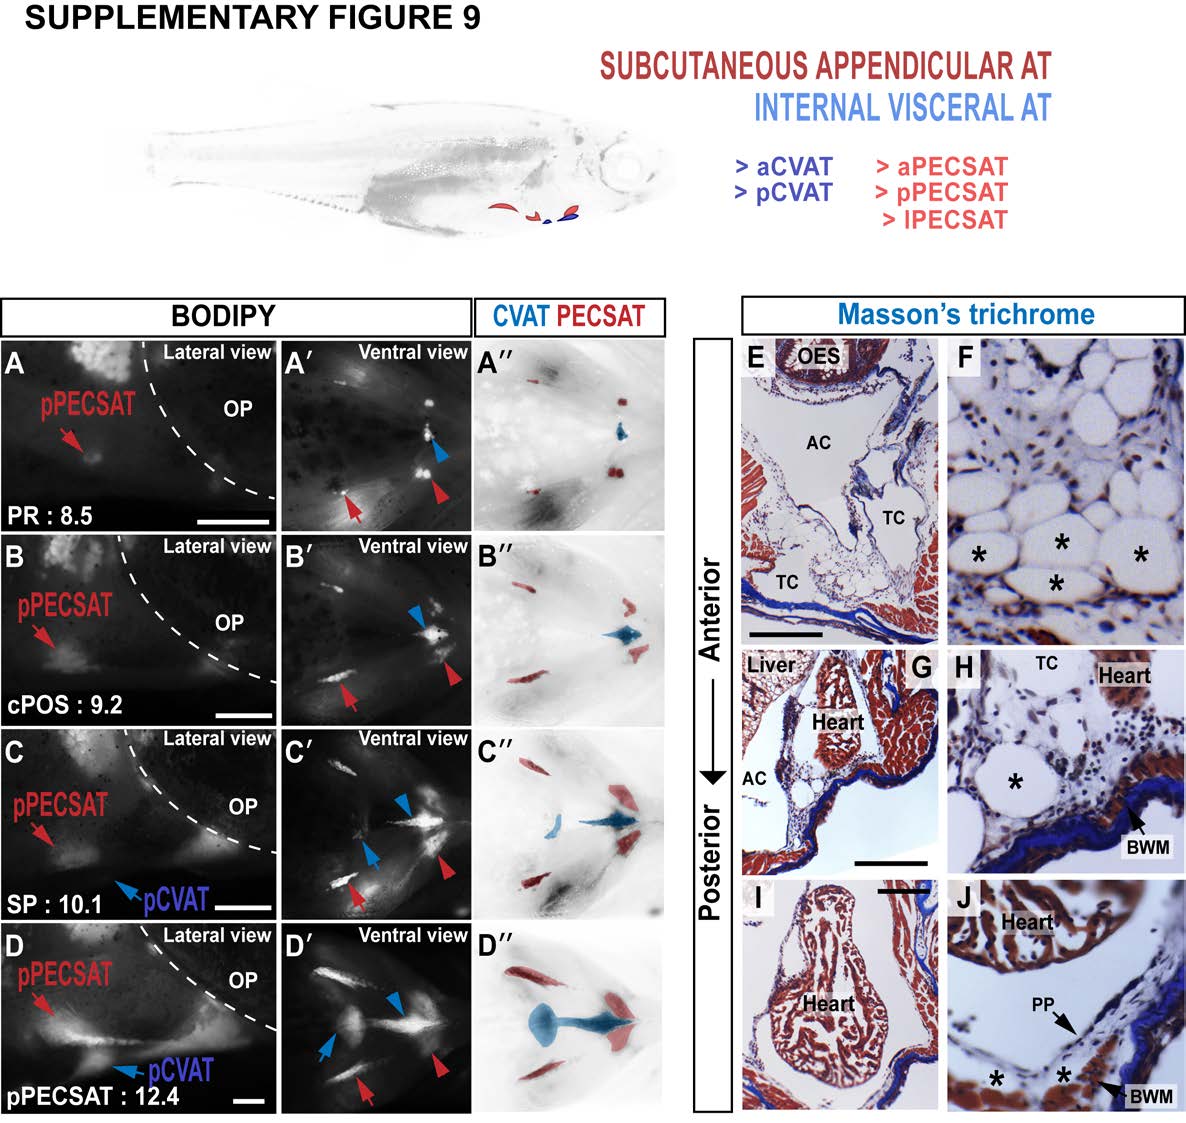
Fig. S9
Morphology of cardiac VAT (CVAT) and pectoral fin SAT (PECSAT). AD. Timeseries indicating the progression of CVAT and PECSAT development. Fish are stained with BODIPY. Arrows indicate pPECSAT (red) and pCVAT (blue). A'-D'. Ventral views of the same fish in A-D. Arrows indicate pPECSAT (red) and pCVAT (blue), and arrowheads indicate aPECSAT (red) and aCVAT (blue). A''-D''. False coloured images of A'-D'. Red ATs are PECSAT, blue ATs are CVAT. E-J. Masson's trichrome-stained cross-sections through the adult zebrafish heart. Sections are at 3 distinct anteriorposterior levels. Note the accumulation of aCVAT in anterior locations (E, F), and its spread posterior (G-J). CVAT does not become fully enveloped by BWM (G & J). Asterisk indicates adipocyte-LDs. Scale bars are 100 µm (A-D) and 250 µm (E, G & I). OP = operculum, OES = oesophagus, AC = abdominal cavity, TC = thoracic cavity, PP = parietal pericardium, BWM = body wall musculature.