
|
Fig. S3
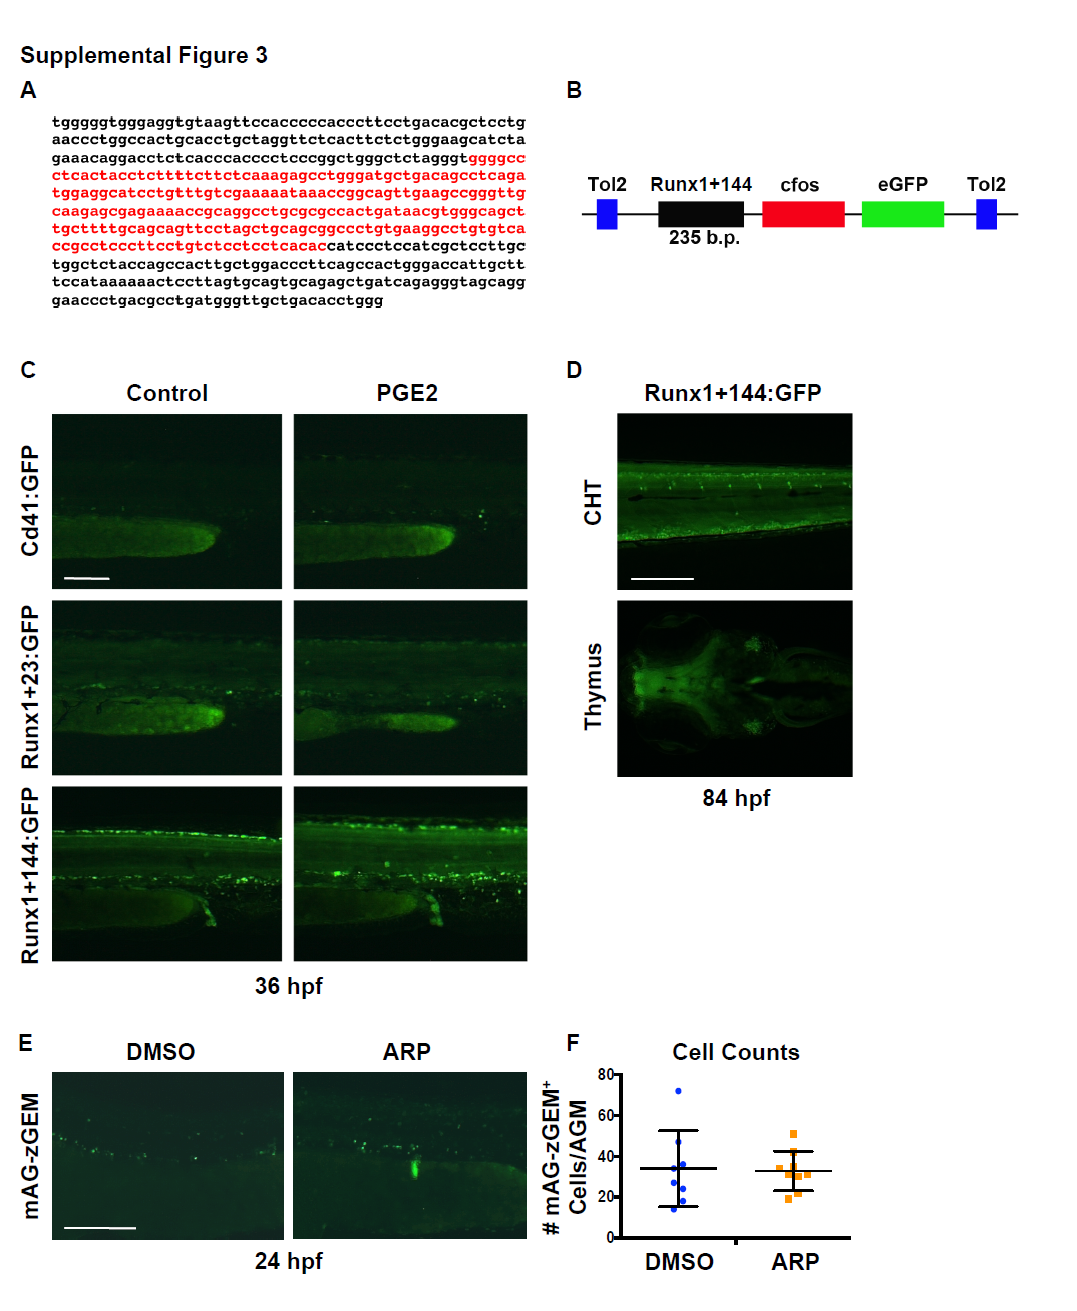
Validation of the Tg(runx1+23(144-378):egfp) HSPC reporter transgenic zebrafish line and characterization of the effect of Mmp2 inhibition on cell proliferation.
Related to Figure 3.
A) Genomic DNA sequence corresponding to the murine +23 Runx1 enhancer (black) and the internal 144-378 base pair fragment (Runx1+23(144-378), red).
B) Schematic representation of the Runx1+144:GFP DNA construct used to create the Tg(runx1+23(144- 378):eGFP) line; a Tg(runx1+23:egfp) transgenic reporter genetically similar to the recently published Tg(runx:egfp) line (Tamplin et al., 2015) was also created using the full murine enhancer sequence.
C) Representative fluorescence pattern Cd41:GFP+, Runx1+23:GFP+ and Runx1+144:GFP+ cells in the AGM of transgenic embryos at 36 hpf after treatment with dmPGE2 (10μM; 12-36 hpf) compared to DMSO controls, measured with the same length of exposure time.
D) Representative images of Runx1+144:GFP expression in the CHT (top) and thymus (bottom) at 84 hpf.
E) Exposure to ARP-101 (ARP, 10μM) from 12-24 hpf does not impact the appearance of proliferating cells in the AGM of Tg(EF1:mAG-zGEM(1/100); kdrl:dsred) embryos compared to controls at 24 hpf.
F) Quantification of the number of mAG-zGEM (G2/M)+ cells in the AGM of embryos from S3E (DMSO: 34.0 ±18.6; MMP9-I: 32.8 ±9.64, p=0.865, 2-tailed t-test, n≥7 embryos/condition). Error bars: mean ± SD.
Scale bars: 100μm.