
|
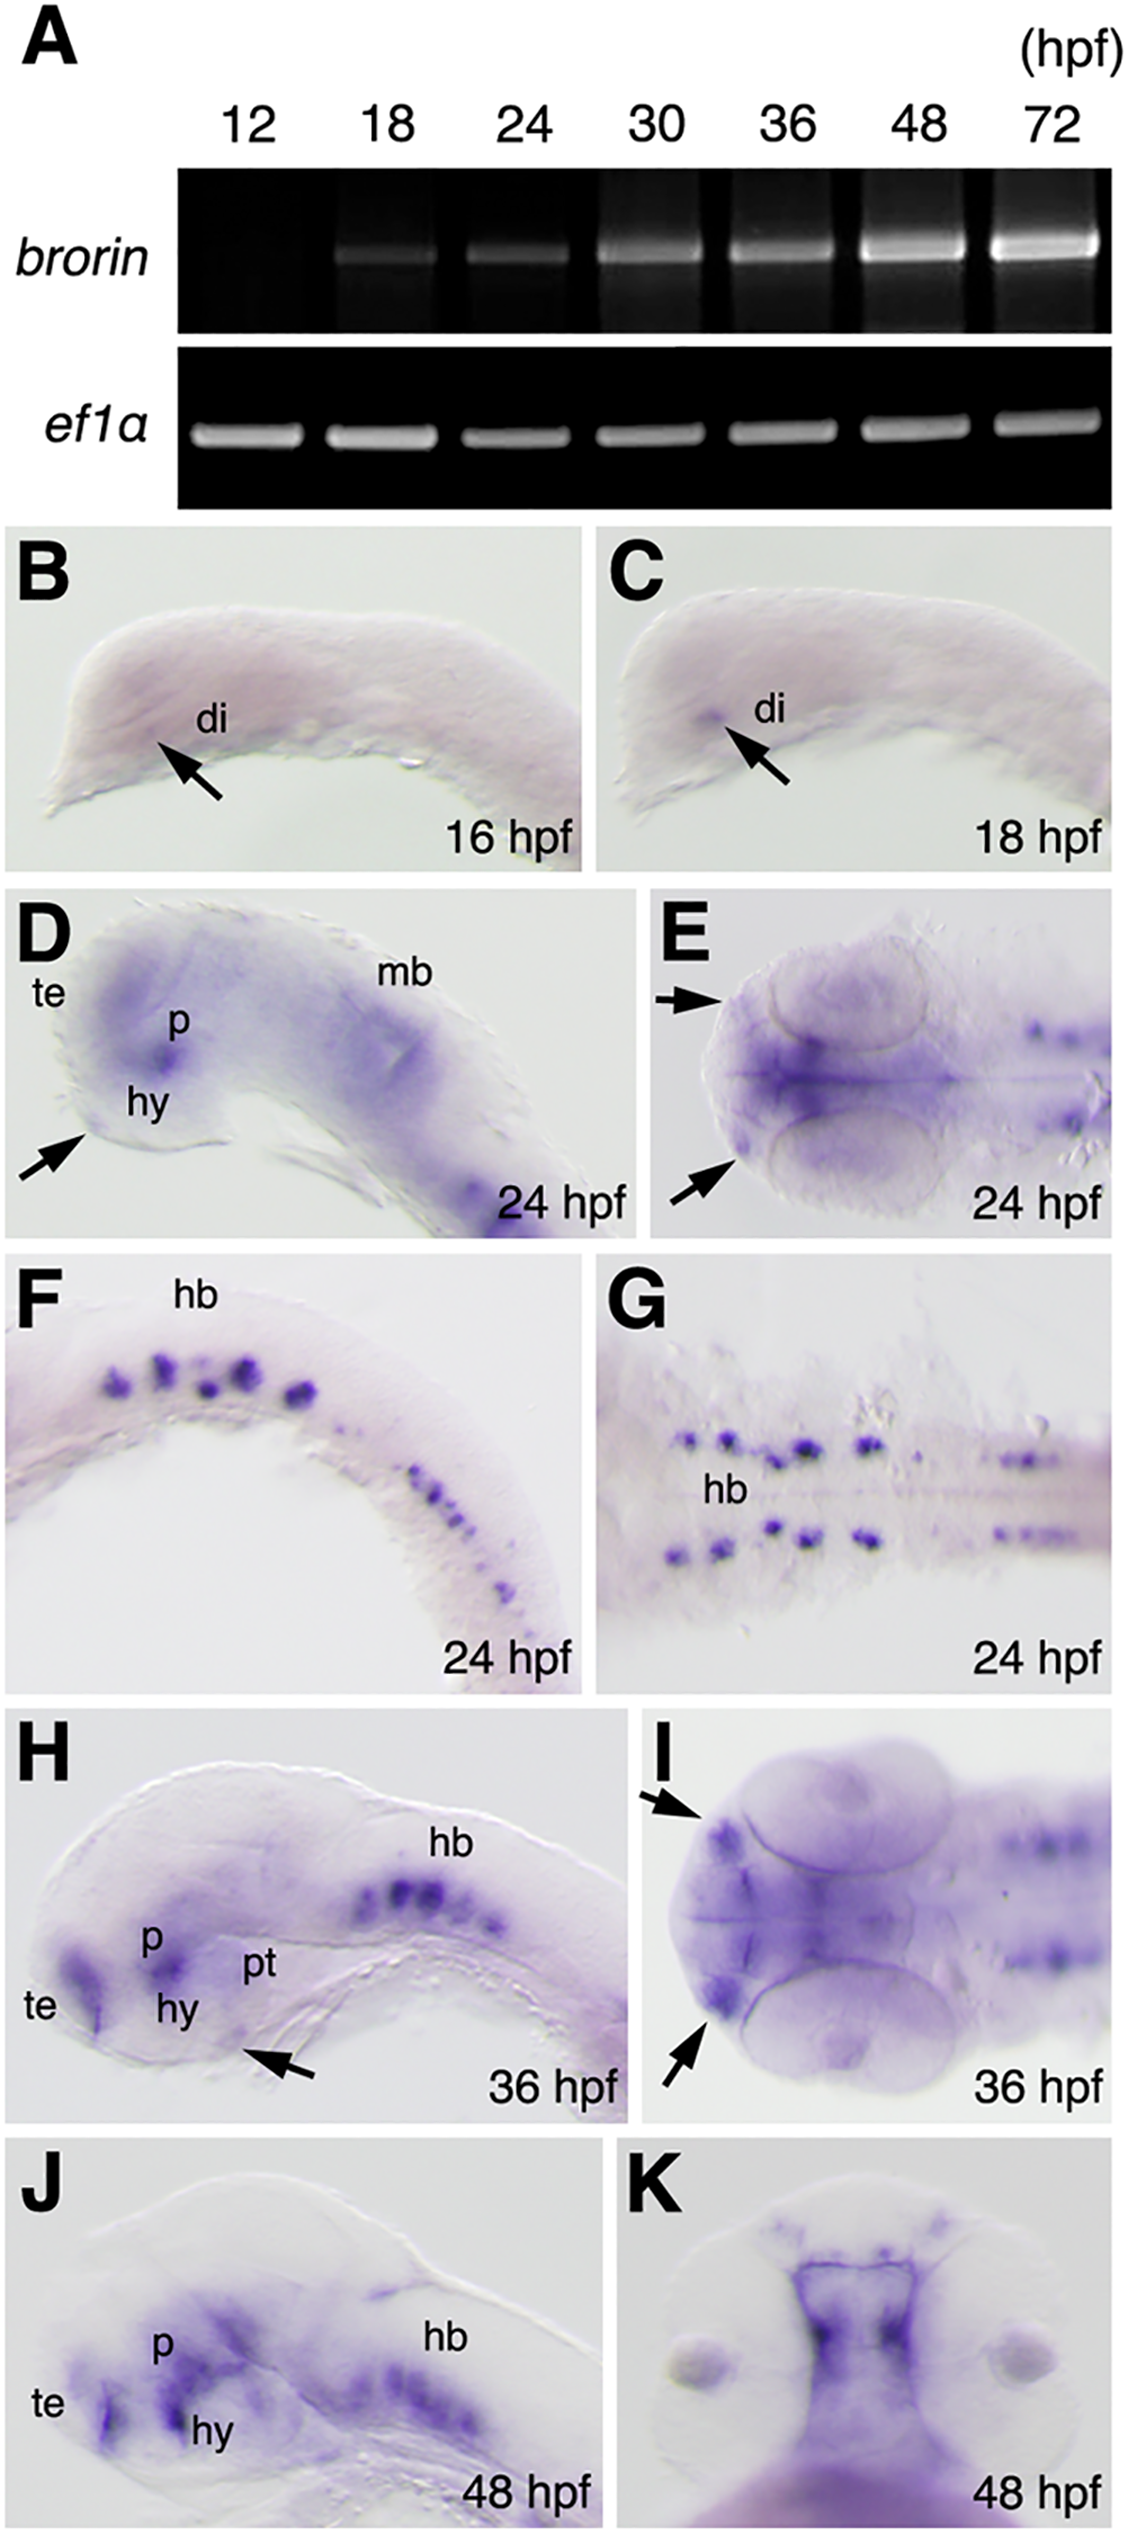
Fig. 2
Pattern of brorin expression in zebrafish embryos.
(A) Amplification of brorin by RT-PCR at the indicated stages (the lower panel shows ef1α as a control). (B-K) Expression of brorin in zebrafish embryos at the indicated stages as detected by whole-mount in situ hybridization. B-D, F, H, and J are lateral views, anterior to the left; E is the ventral view; G and I are dorsal views; K is the frontal view. Arrows in panels D and H indicate the pituitary gland. Arrows in panels E and I indicate the olfactory placode. ac, anterior commissure; di, diencephalon primordium; hb, hindbrain; hy, hypothalamus; mb, midbrain; p, prethalamus; pt, posterior tuberculum; te, telencephalon.