
|
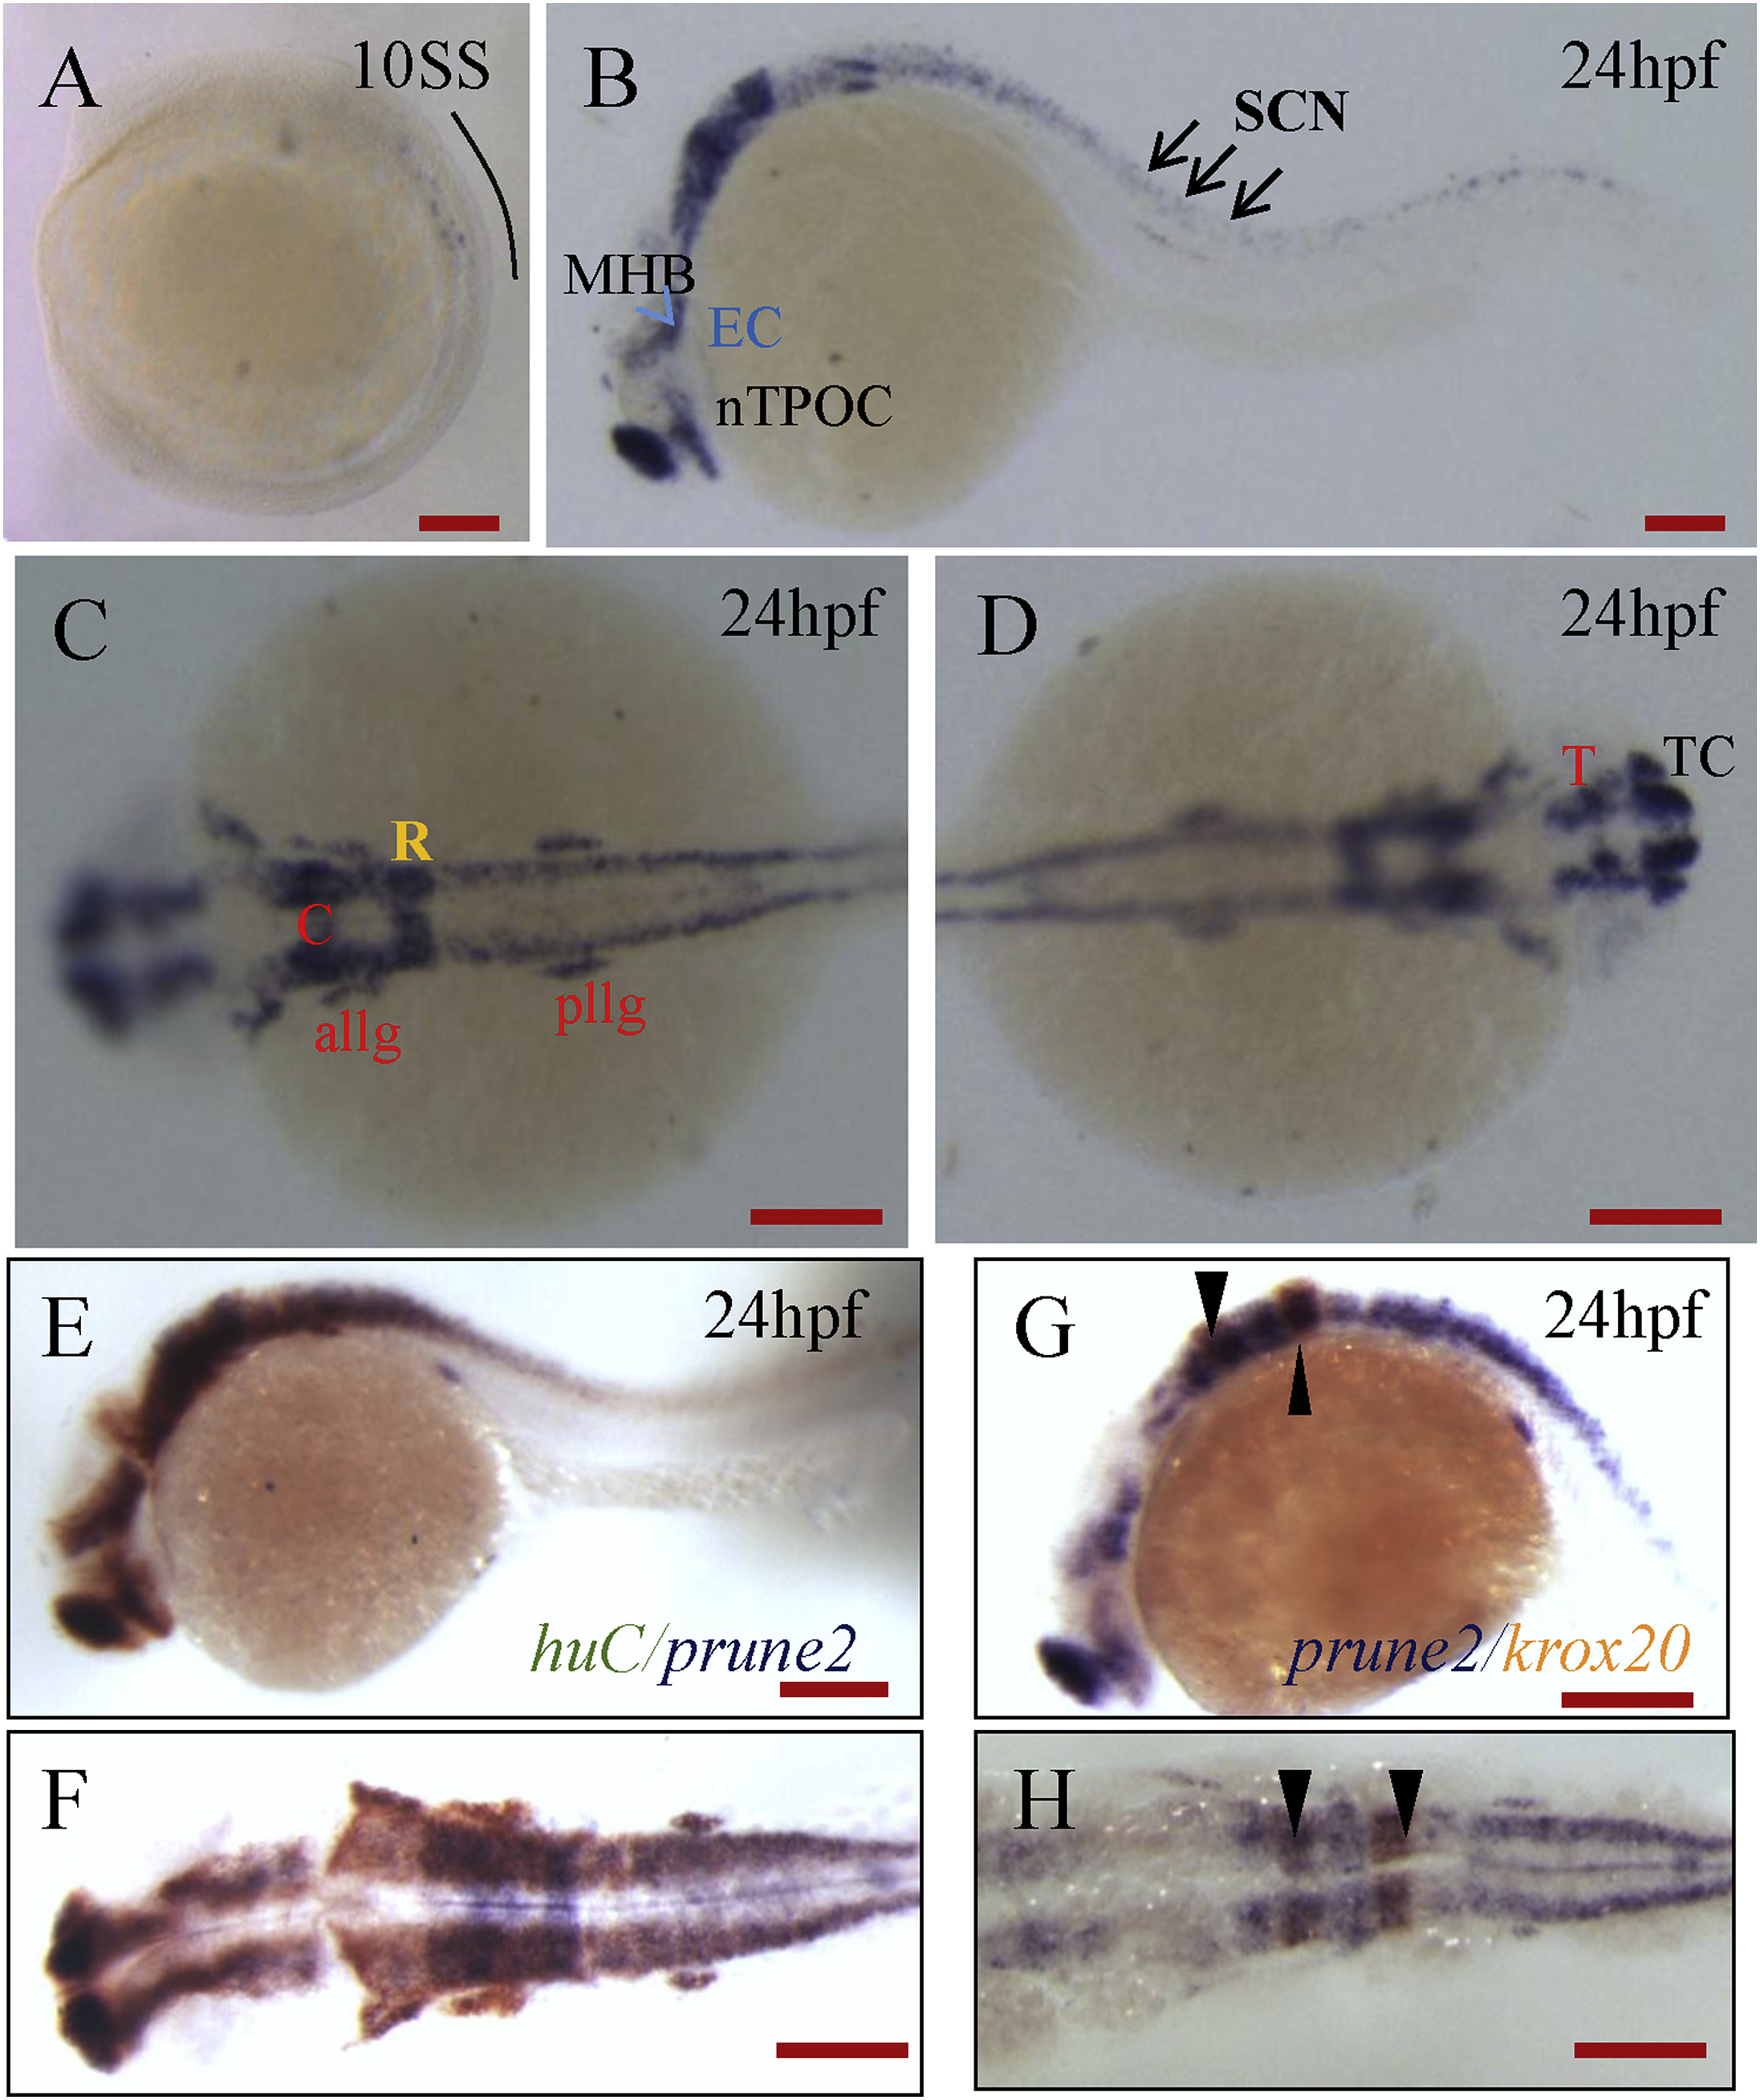
Fig. 2
WISH analysis for spatio-temporal patterns of prune2 transcripts during segmentation stages. (A) prune2 maternal transcripts were evident at 10 somites stage. (B–D) prune2 transcripts were expressed in the TC; telencephalon, SCN; spinal cord neurons,C; cerebellum, T; tegmentum, EC; epiphysis, nTOPC; nucleus of the tract of the post optic commissure, allg; anterior lateral line ganglion, pllg; posterior lateral line ganglion, and R; rhombomeres. (E, F) Two color WISH for spatiotemporal distribution of the transcripts from prune2 transcripts and huC (fluorescence-label). (G, H) Two color WISH for spatiotemporal distribution of the transcripts from prune2 and krox20 (fluorescence-label). Arrowheads indicate R3 and R5. All scale bars in red indicate 50 μm. A, B, E, G; lateral view anterior to left. C, D, F, H; dorsal view, C, F, H; anterior to left, and D; anterior to right.
Reprinted from Gene expression patterns : GEP, 23-24, Anuppalle, M., Maddirevula, S., Kumar, A., Huh, T.L., Choe, J., Rhee, M., Expression patterns of prune2 is regulated by Notch and retinoic acid signaling pathways in the zebrafish embryogenesis, 45-51, Copyright (2017) with permission from Elsevier. Full text @ Gene Expr. Patterns