
|
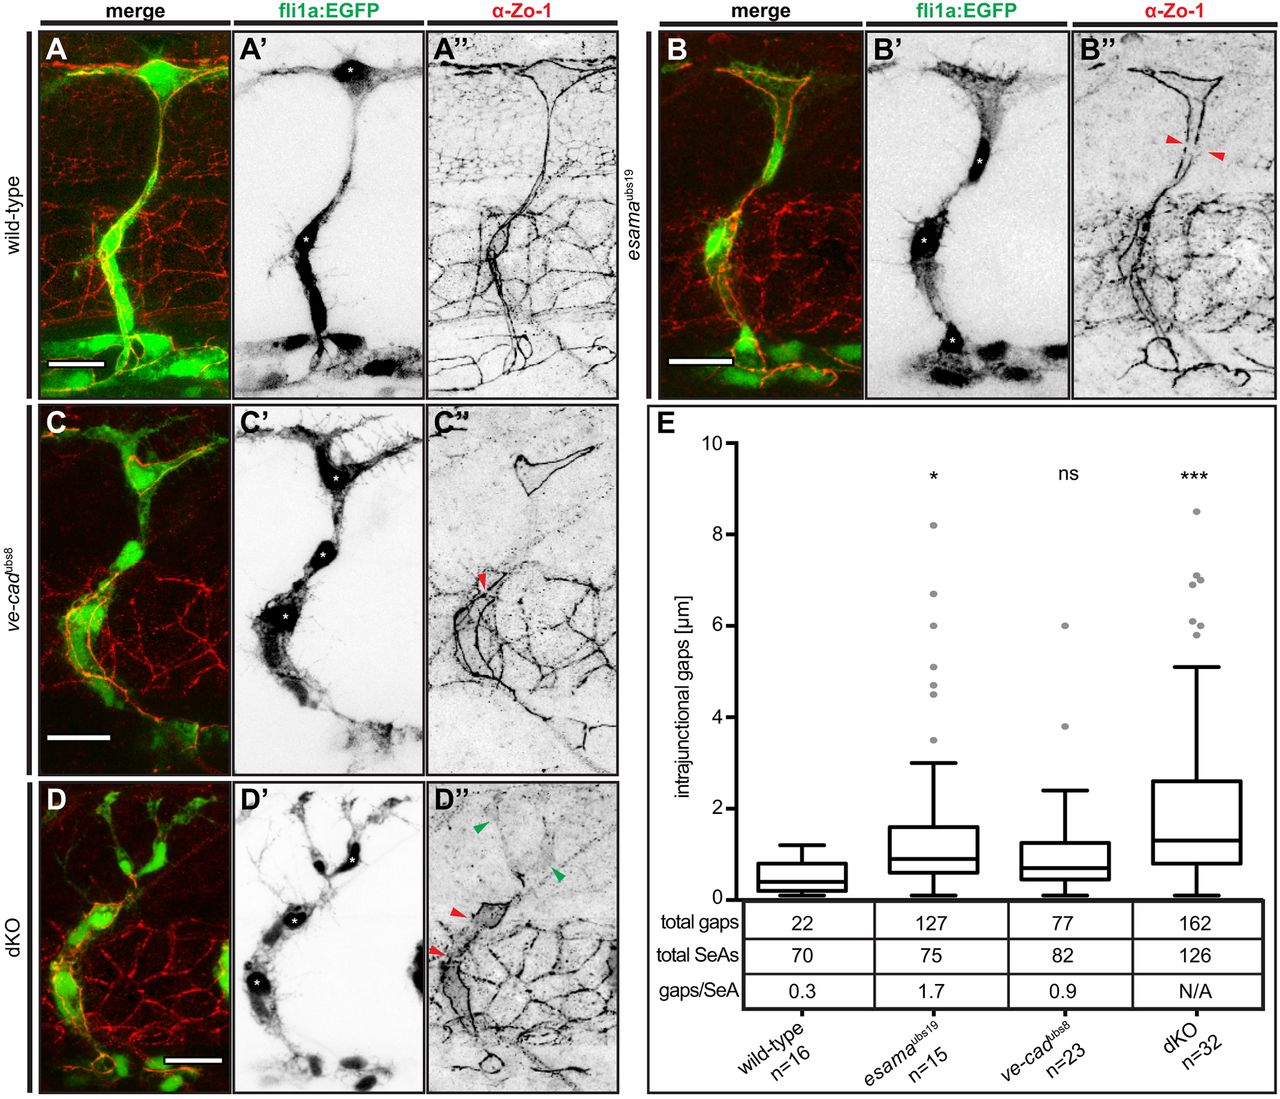
Fig. 5
Defects in junctional continuity in the absence of Esama, which are greatly increased in double mutants. (A-D) Confocal images of SeAs of Tg(fli1a:EGFP)y1 (green) wild-type (A), esamaubs19 (B), ve-cadubs8 (C) and esamaubs19; ve-cadubs8 dKO (D) embryos stained for Zo-1 (red), around 32 hpf. Single channels are shown in inversed contrast. Red arrowheads point to intrajunctional gaps or missing junctions between the red arrowheads in (D″); green arrowheads indicate cytoplasmic localization of Zo-1. Asterisk, nucleus. Scale bars: 20 µm. (E) Intrajunctional gaps (in micrometers) measured in confocal projections of embryos stained for Zo-1 around 32 hpf. One-way analysis of variance revealed significance for esamaubs19 (P=0.0449), ve-cadubs8 (P=0.42) and double mutant (P<0.0001). Tukey boxplot shows boxes with lower quartile, median and upper quartile (Tukey whiskers). Medians are 0.4, 0.9, 0.7 and 1.3 µm for wild type, esamaubs19, ve-cadubs8 and dKO, respectively. The number of observed intrajunctional gaps (total gaps), the number of analyzed SeAs (total SeAs) and the calculated number of intrajunctional gaps per SeA (gaps/SeA) are indicated below the boxplot for every genotype. The number of intrajunctional gaps per SeA is omitted for the double mutant genotype, because strong junctional defects did not allow a quantitative analysis. dKO, double mutant; n, number of embryos analyzed; N/A, not available (omitted); SeA, segmental artery. *P<0.05; ***P<0.001.