
Image
|
Figure Caption
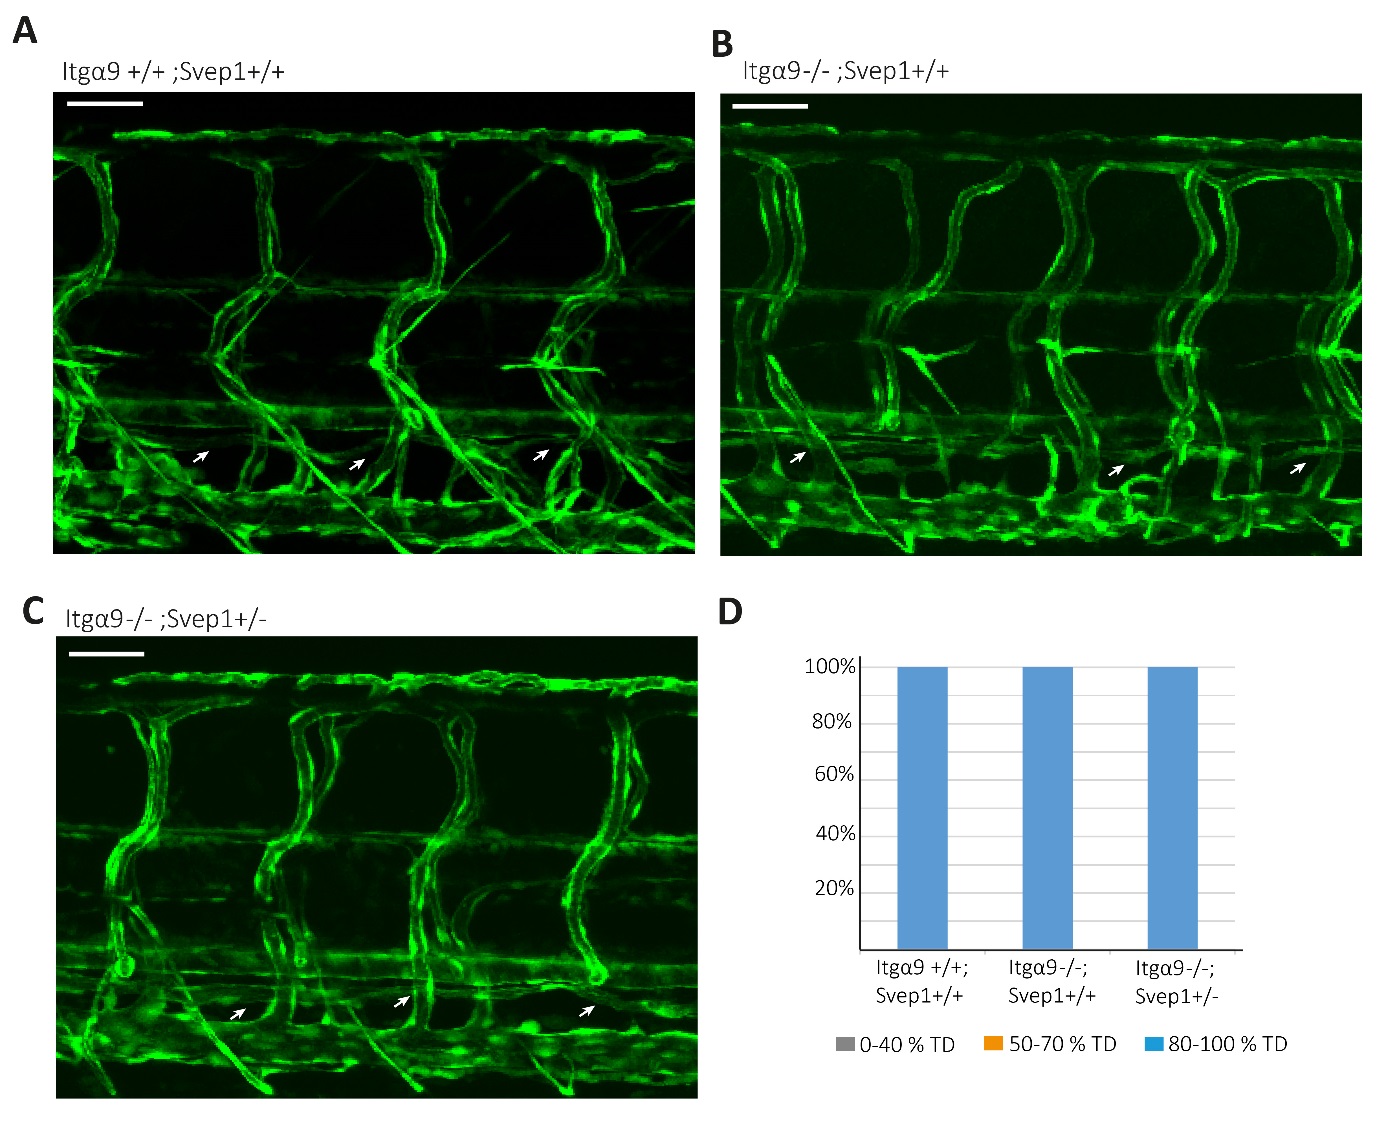
Fig. S9
Genetic interaction of Svep1 and Itgα9: A-C: Lateral view of representative examples of fli1a:GFP transgenic embryos that are either wildtype for both svep1 and integrin α9 (A), mutant for integrin α9 (B), or mutant for integrin α9 and heterozygous for svep1 (C). Neither of the genetic combinations shows a thoracic duct (arrows) phenotype. Hence, we have found no evidence for a genetic interaction of integrin α9 and svep1. D: Quantification of the embryos presented in (A-C).
Figure Data
Acknowledgments
This image is the copyrighted work of the attributed author or publisher, and
ZFIN has permission only to display this image to its users.
Additional permissions should be obtained from the applicable author or publisher of the image.
Full text @ Circ. Res.