
|
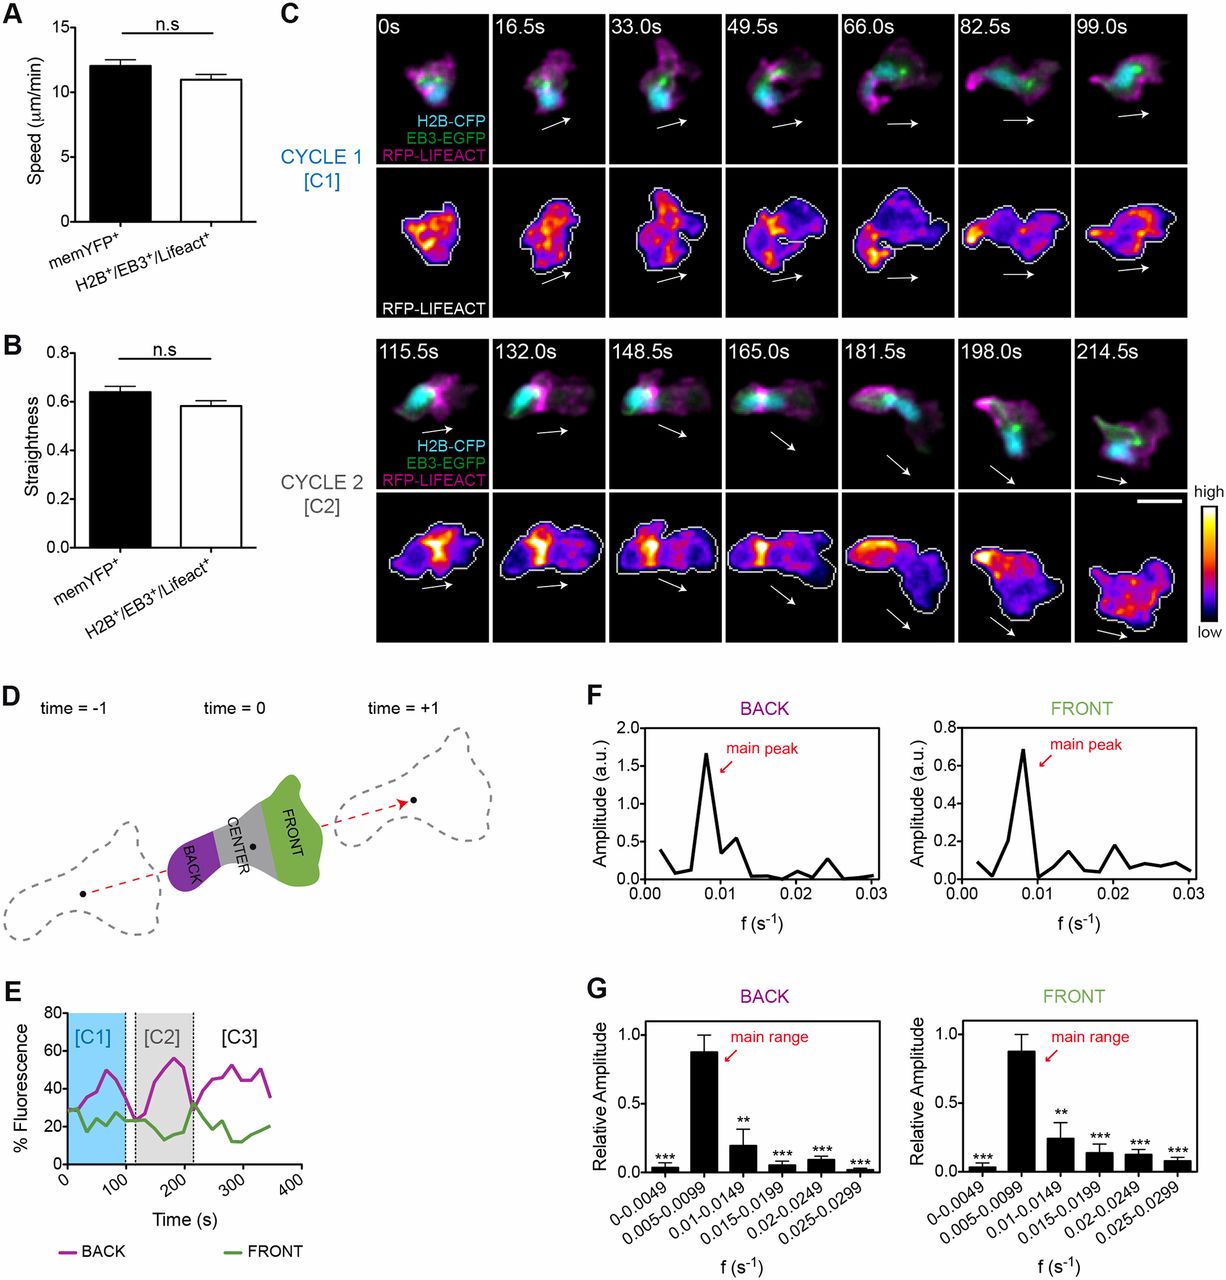
Fig. 2
F-actin shows an oscillatory anteroposterior polarity during wound-directed migration of leukocytes in vivo. (A,B) Quantification of 2D (A) speed and (B) path straightness of memYFP+ or H2B–CFP+ EB3–EGFP+ RFP–Lifeact+ leukocytes migrating to wounds. Data are expressed as the mean±s.e.m. of all analyzed cells (memYFP+, n = 75 cells in three larvae; H2B–CFP+ EB3–EGFP+ RFP–Lifeact+, n = 64 cells in three larvae); ns, non-significant; two-tailed unpaired Student's t-test. (C) Two consecutive cycles (C1 and C2) of front-to-back F-actin waves (lower panels) were visualized in transgenic larvae coexpressing RFP–Lifeact and EB3–EGFP in myeloid cells [TG(FmpoP:: EB3–EGFP/FmpoP::RFP–Lifeact)], following transient expression of H2B–CFP as a nuclear marker (upper panels). Shown are frames from representative movies of myeloid cells migrating in the wounded tailfin. The white arrows indicate the direction of migration. Cell outlines are indicated by the gray line. Scale bar: 10 µm. (D) Schematics of the 2D geometric compartmentalization used to quantify F-actin subcellular distribution. Black dots indicate the cell centroid shown at three consecutive time-points, and the dashed red arrow indicates the direction of migration vector. (E) Timecourse of F-actin front and back fluorescence signal distribution in the cell depicted in C. Cycle C1 and C2 are those visualized in C. (F) Fourier spectra showing the time frequencies that compose the oscillatory signal of F-actin in the back and front regions of the cell shown in C. The peak with the highest amplitude value (main peak) corresponds to the predominant frequency of oscillation. Frequencies with lower amplitude values are also displayed and give a minor contribution to the oscillatory signal. a.u., arbitrary units. (G) Histograms showing the relative contribution of ranges of frequencies to back and front F-actin oscillations. Note that a predominant range of oscillatory frequencies (main range) emerges from ranges of secondary frequencies. Data are expressed as the mean±s.e.m. of all analyzed cells (n = 8 cells in four larvae); statistical analysis was performed between the main range and each of the remaining ranges of frequencies; **P<0.01; ***P<0.001 (two-tailed paired Student's t-test). See also supplementary material Fig. S2; Movie 4.