
Image
|
Figure Caption
Fig. S4
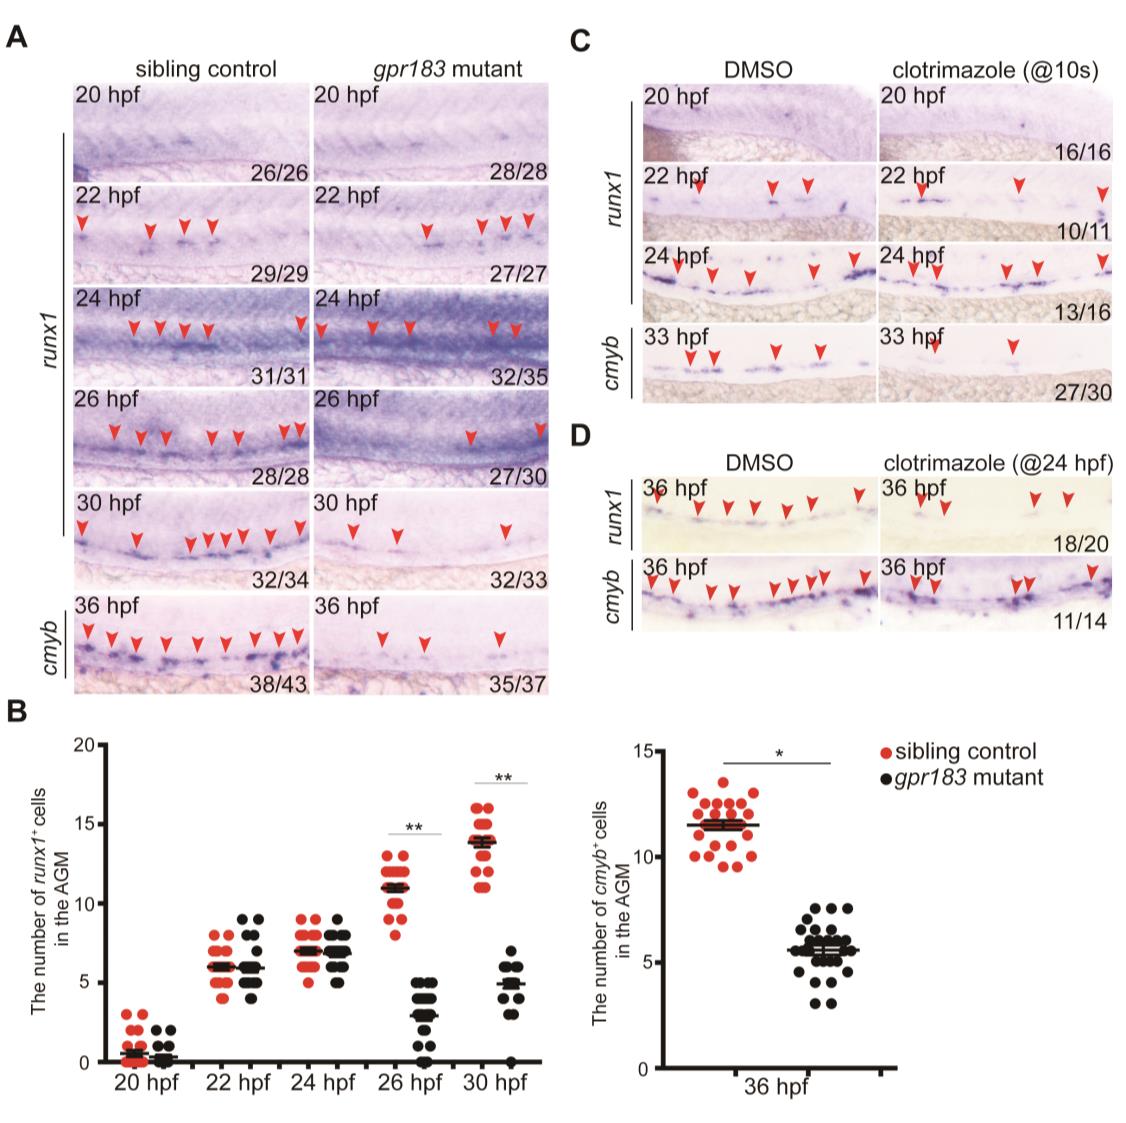
Gpr183 influences HE development after 24 hpf. (A, B) Time-course expression of runx1/cmyb in gpr183 mutants and the dot-blot quantification analysis. Error bar, ±s. d. *p<0.05, **p<0.01. (C) Time-course expression of runx1/cmyb in embryos treated with clotrimazole (from 10 somites). (D) runx1/cmyb expression in embryos treated with clotrimazole (from 24 hpf). Red arrowheads denote runx1/cmyb expression in the AGM region.
Acknowledgments
This image is the copyrighted work of the attributed author or publisher, and
ZFIN has permission only to display this image to its users.
Additional permissions should be obtained from the applicable author or publisher of the image.
Full text @ Cell Res.