
|
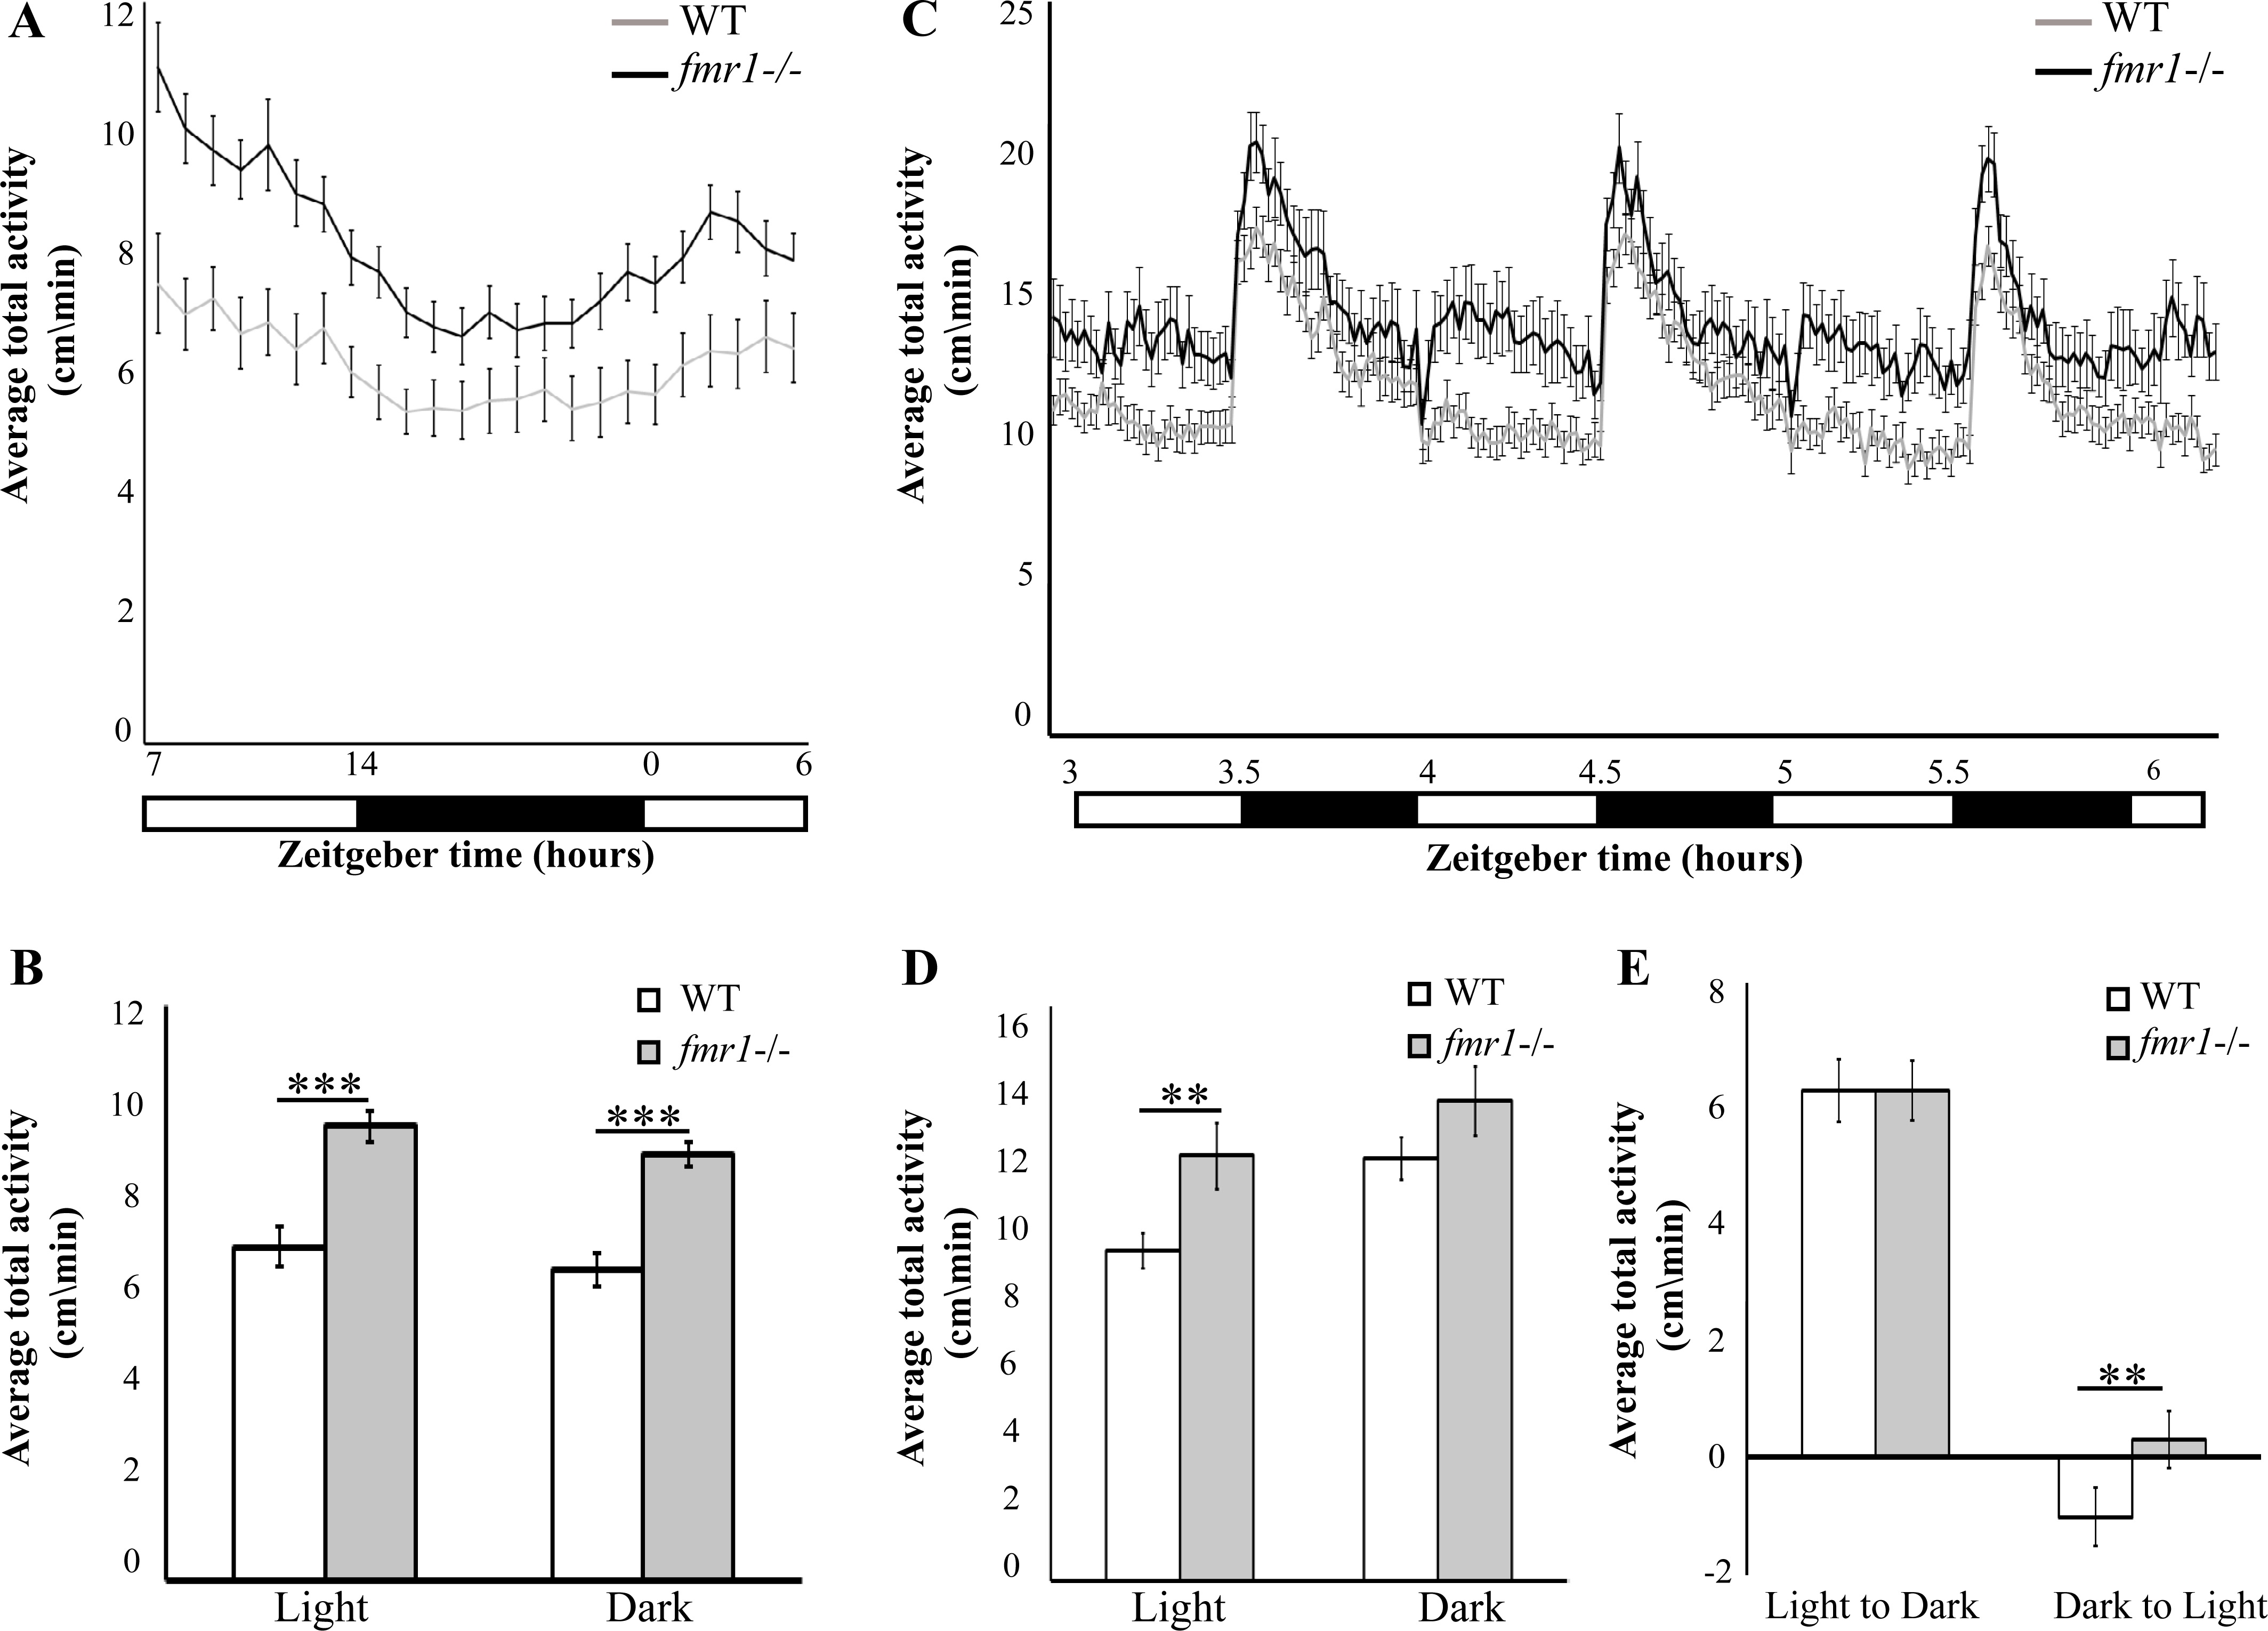
Fig. 2 Hyperlocomotor activity and altered response to dark-to-light transition in fmr1-/- larvae.
A. Locomotor activity (cm/min) recording was performed in 6 dpf fmr1-/- larvae (black line) and WT larvae (grey line) throughout a daily cycle under a 14 h light/10 h dark cycle. fmr1-/- larvae are hyperactive during both day and night (WT, n = 30; fmr1-/-, n = 34, ***p<0.0001). B.Average total activity (cm/min) during both day and night is presented for 6 dpf fmr1-/- and WT larvae. Values are represented as means ± SEM (*p<0.05, two-way t-test assuming unequal variances). C. Larvae were kept under alternating 30-min light/dark cycles during the day. The fmr1-/- larvae were hyperactive compared with WT larvae during the light periods (WT, n = 177; fmr1-/-, n = 179). D. Total average activity under alternating 30-min light/dark cycles during the day during both light and dark periods, is presented for 6 dpf fmr1-/- larvae and WT larvae. Values are represented as means ± SEM (*p<0.05, two-way t-test assuming unequal variances). E. Transition analysis demonstrating the differences in total average activity per genotype, calculated by comparing 5 min after and 5 min before light-to-dark and dark-to-light transitions. While the WT larvae showed reduced activity, the fmr1-/- larvae showed increased activity during the dark-to-light transitions (**p<0.005). Values are represented as means ± SEM. Statistical significance was determined by using a two-way t-test assuming unequal variances.