
|
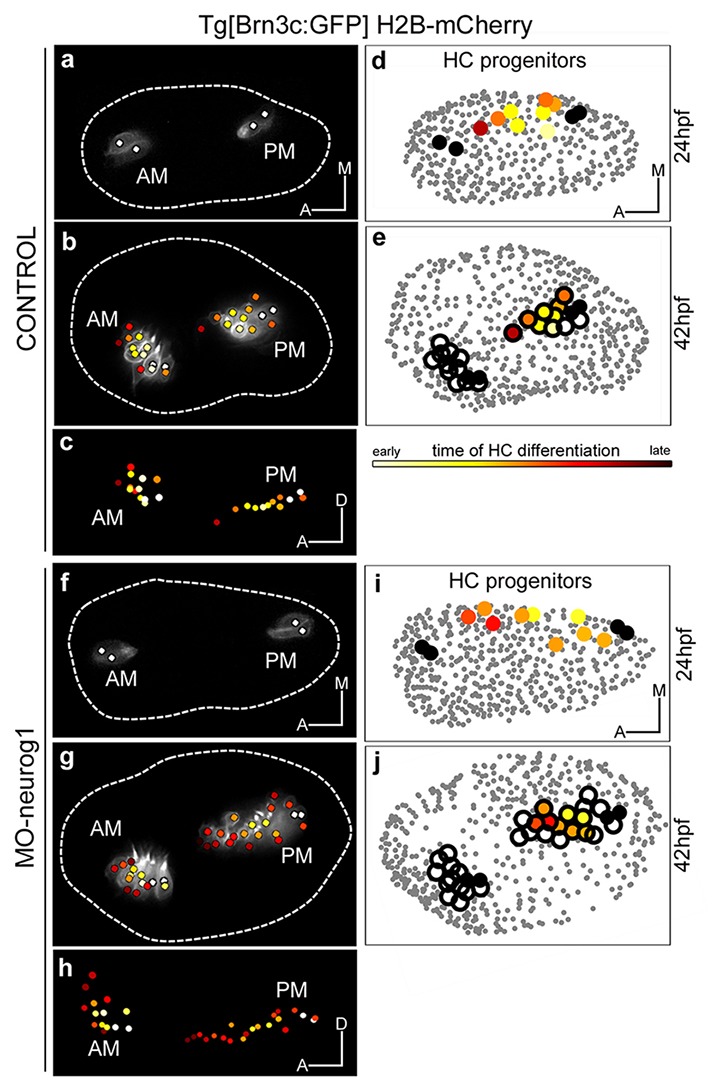
Fig. 4
Spatiotemporal pattern of hair cell differentiation and map of sensory progenitors.
Differentiated hair cells were tracked during 18 hr in control and MO-neurog1, and reconstructed cell centers were color-coded according to the differentiation time displayed in the legend (Video 6). (a–b,f–g) Spatiotemporal pattern of hair cell differentiation of the anterior/posterior maculae (AM/PM); reconstructed colored cell centers overlaid with the corresponding raw images (hair cell fate in grey level) from Tg[Brn3c:GFP] embryos; (c,h) reconstructed colored cell centers in lateral view. Note how the temporal but not the spatial development is altered in the MO-neurog1 PM (see Figure 4—figure supplement 1). (d,i) Map of hair cell progenitors in the whole otic vesicle (Videos 7-8); the maps were generated by backtracking the differentiated PM hair cells (e,j). ID Datasets: 140507aX for control, 140519aX for MO-neurog1; see Figure 4—figure supplement 1 for additional analyses