
|
Fig. 2 S1
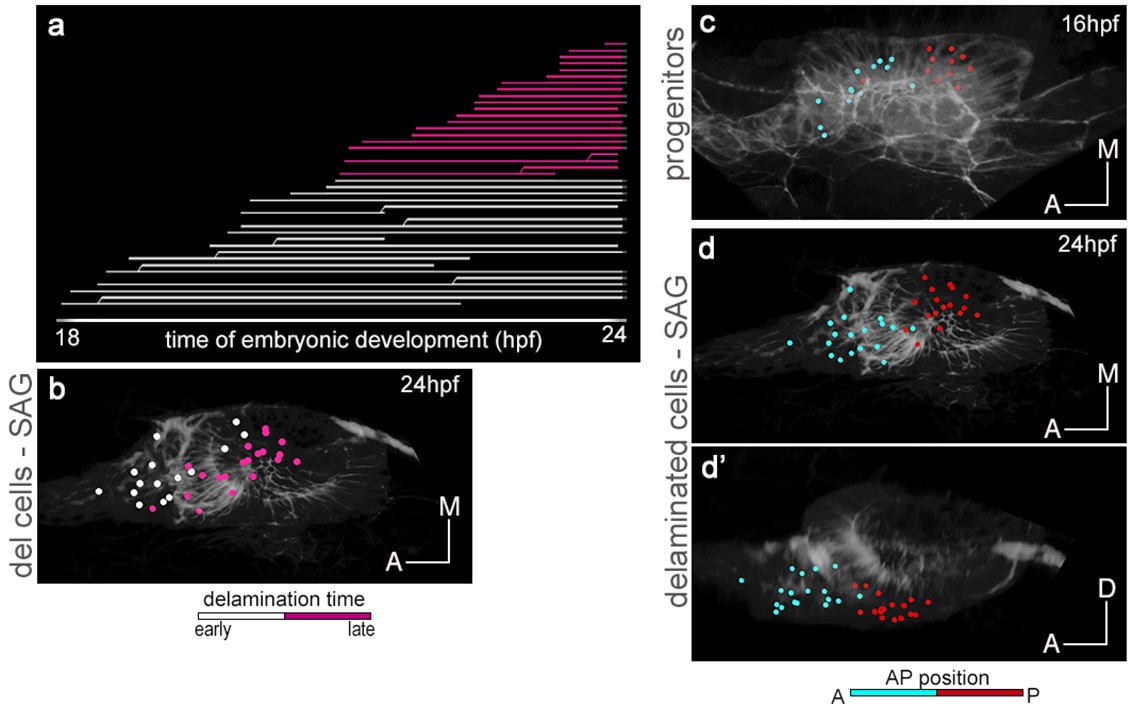
Time of delamination and position of epithelial neuroblasts prefigure their location within the SAG.
Tg[cldnb:lynGFP] Tg[Brn3c:GFP] embryo was injected with H2B-mCherry at 1cell-stage, imaged and analyzed from 16 hpf (Table 1). Reconstructed cell centers from neuronal progenitors were color-coded for time of delamination (a), or position along the AP axis in the otic epithelium (c), and followed from 18 hpf to 24 hpf. Note that: (i) among the delaminated neuroblasts from 18 hpf to 24 hpf, those delaminating earlier (white cell centers in a-b) are more medially located in the SAG than those delaminating later (purple cell centers in a-b); and (ii) the relative position of neuronal precursors along the AP axis in the otic epithelium is conserved within the SAG (see cyan anterior cells vs. red posterior cells in c-d’). ID dataset: 140423aX.