IMAGE

Fig. S1

ID
ZDB-IMAGE-170222-73
Source
Figures for Wild et al., 2017
Image
Figure Caption

Fig. S1

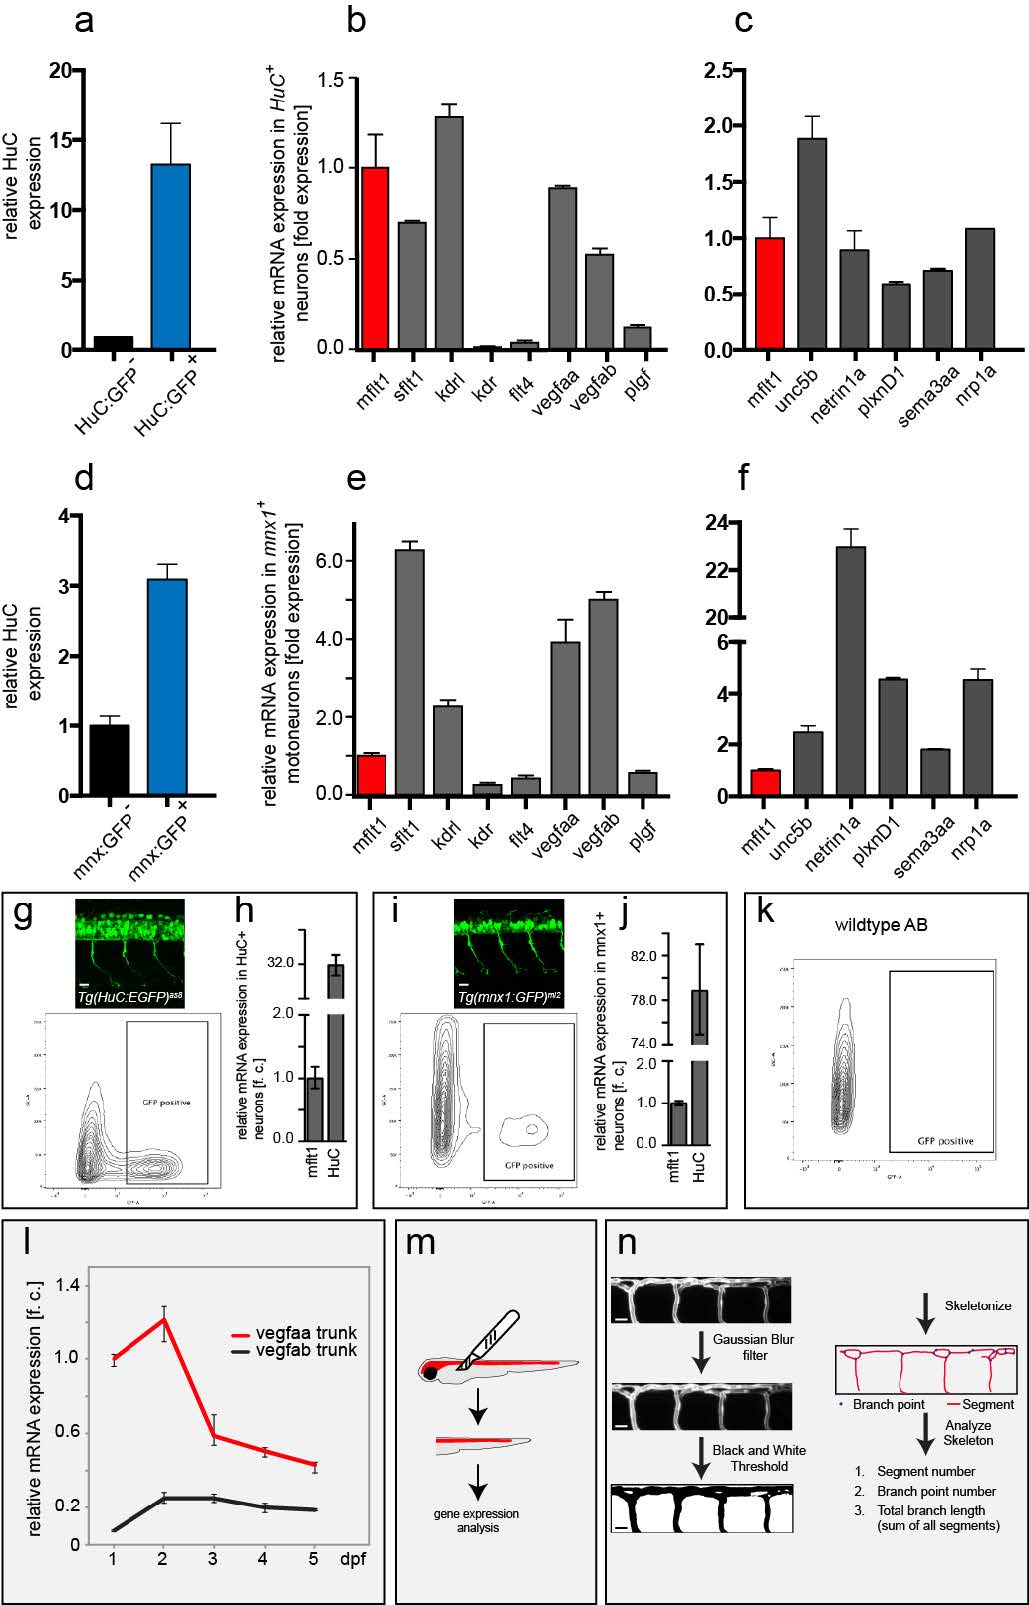
FACS of neuronal cells

(a-f) Neuronal cells were isolated from Tg(HuC:EGFP)as8 embryos and Tg(mnx1:GFP)ml2 embryos at 24hpf by FACS with indicated gating settings (g-l). (a) Expression of pan- neuronal marker HuC in the GFP positive fraction (HuC:GFP+) and GFP negative fraction (HuC:GFP-) sorted from Tg(HuC:EGFP)as8 embryos. (b) Quantitative expression (TaqMan) of mflt, sflt1, kdrl, kdr, flt4, vegfaa, vegfab, plgf; (c) Quantitative expression (TaqMan) of unc5b, netrin1a, plexinD1, semaphorin3aa, neuropilin-1a in the GFP positive cell fraction FACS sorted from the pan-neuronal reporter Tg(HuC:EGFP)as8, mean ± s.e.m, n=3 experiments, 60 embryos/experiment. Expression levels were normalized to the expression of mflt1 (mflt1 expression was set at 1.0). (d) Expression of pan-neuronal marker HuC in the GFP positive fraction (Mnx:GFP+) and GFP negative fraction (Mnx:GFP-) sorted from Tg(mnx1:GFP)ml2 embryos. (e) Quantitative expression (TaqMan) of mflt, sflt1, kdrl, kdr, flt4, vegfaa, vegfab, plgf. (f) Quantitative expression (TaqMan) of unc5b, netrin1a, plexinD1, semaphorin3aa, neuropilin-1a in the GFP positive cell fraction FAC sorted from the pan neuronal reporter Tg(HuC:EGFP)as8, mean ± s.e.m, n=3 experiments, 60 embryos/experiment. Expression levels were normalized to the expression of mflt1 (mflt1 expression was set at 1.0). (g-k) Gating settings for (g,h) Tg(HuC:EGFP)as8 embryos, (i,j) Tg(mnx1:GFP)ml2 embryos. The pictures in the inset indicate the in vivo expression domains of (g) HuC and (i) mnx1. Note that HuC marks all spinal cord neurons; mnx1 marks only the motoneuron population. (k) Verification of gating settings in control embryos. (l,m) Tails were dissected from zebrafish embryos between 24hpf and 5dpf, RNA was isolated and used for vegfaa and vegfab real-time qPCR. (l) Quantitative expression of vegfaa and vegfab in the trunk of zebrafish embryos at indicated time points; mean ± s.e.m, n=3 experiments, n=30 embryos/experiment. (m) Semi-automated vascular network analysis was performed using ImageJ with indicated plugins. Vessel segment number, branch point number and total branch length was determined. Scale bar, 25μm in g,i,m.

Acknowledgments
This image is the copyrighted work of the attributed author or publisher, and ZFIN has permission only to display this image to its users. Additional permissions should be obtained from the applicable author or publisher of the image. Full text @ Nat. Commun.