
|
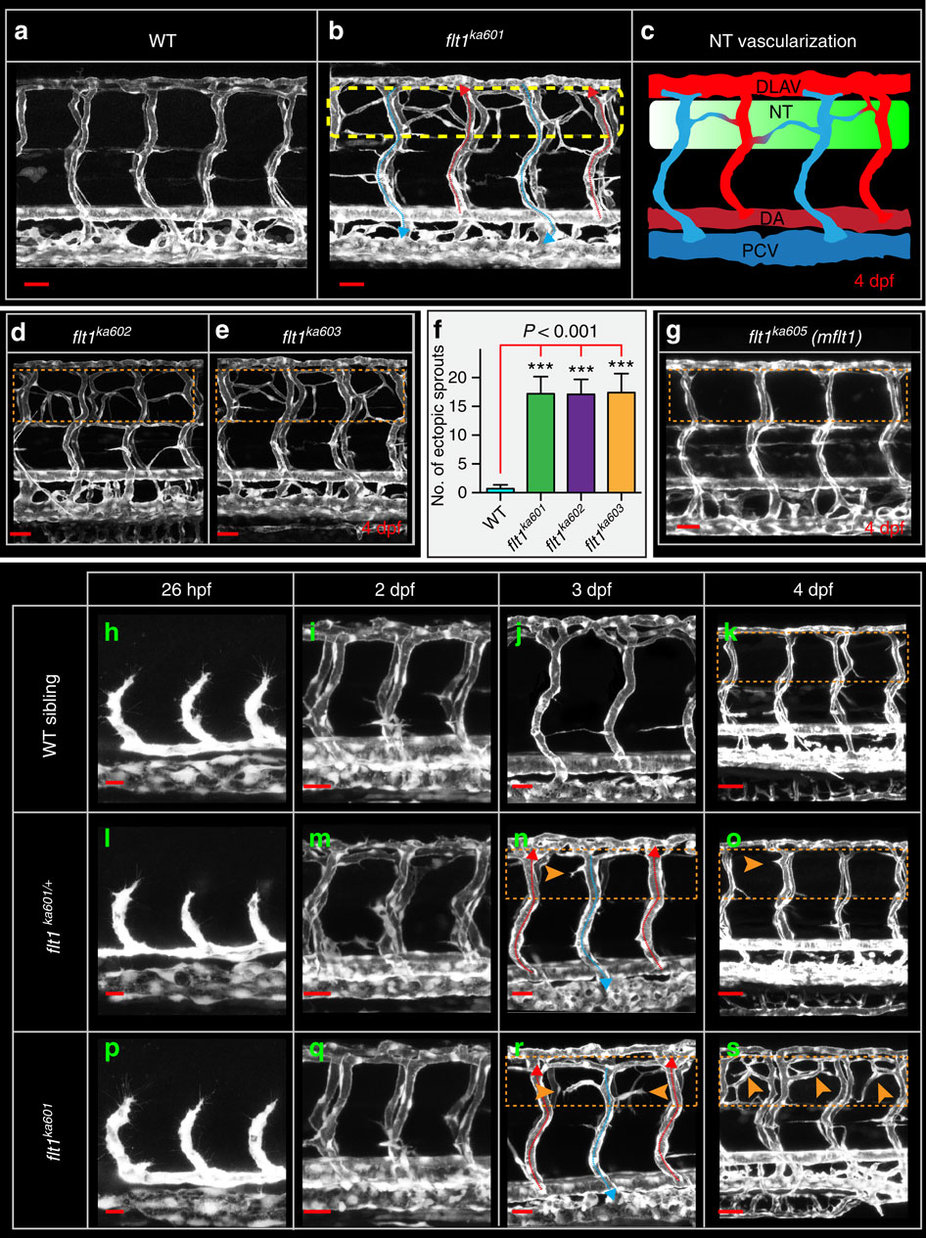
Fig. 2
Flt1 mutants develop hyper-branched vascular networks at the level of the neural tube.
(a) Trunk vasculature in 4 dpf WT sibling, (b) trunk vasculature in 4 dpf flt1ka601 mutant, in Tg(kdrl:EGFP)s843 background. Perfused aISVs with red arrow, veins with blue arrow. Note the extensive amount of hyper-branching (dotted box) at the level of the neural tube. (c) Schematic representation of hyper-branching phenotype along the neural tube; ectopic vessels make anastomosis between vISV (blue) with aISVs (red). (d) Hyper-branching (dotted box) is also observed in flt1ka602 and (e) flt1ka603 mutants. (f) Quantification of hyper-branching for indicated mutant alleles. Mean±s.e.m., n=10 per group, ANOVA. (g) Membrane-bound flt1 mutant (flt1ka605) without vascular phenotype (compare dotted box in g, with control in a). (h–k) Trunk vascular network in WT embryos at indicated time points. (l–o) Trunk vasculature in flt1ka601 /+ embryos at indicated time points. (p–s) Trunk vasculature in flt1ka601 embryos at indicated time points. Arrowheads indicate ectopic branches. DA, dorsal aorta; PCV, posterior cardinal vein; DLAV, dorsal longitudinal anastomotic vessel; NT, neural tube; hpf, hours post fertilization; dpf, days post fertilization. Scale bar, 50 μm in a,b,d,e,g,i,m,q,k,o,s; 25 μm in h,l,p,j,n,r.