
|
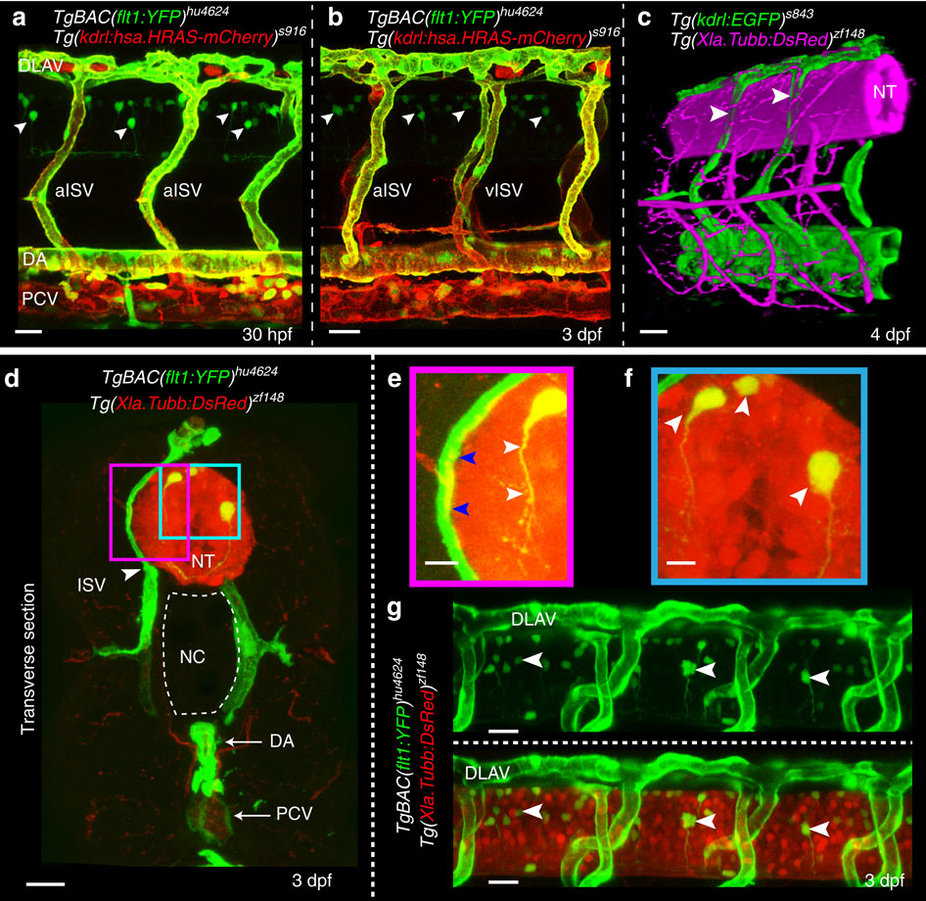
Fig. 1
Expression of Vegf receptors and ligands at the neurovascular interface.
(a,b) Double transgenic embryos TgBAC(flt1:YFP)hu4624; Tg(kdrl:hsa.HRAS-mcherry)916 at 30 hpf and 3 dpf shows flt1 expression (green) in dorsal aorta, arterial ISV and dorsal aspect of venous ISV (3 dpf) and neurons (arrowheads). (c) 3D-rendered view of vessels (green) and nerves (purple) in Tg(kdrl:EGFP)s843;Tg(XIa.Tubb:DsRed)zf148 embryos highlighting dorsal aspect of ISVs (arrowheads) in close contact to the neural tube (NT). (d) Transverse section of the trunk of TgBAC(flt1:YFP)hu4624;Tg(XIa.Tubb:DsRed)zf148 embryos shows that ISVs (green, arrowhead) and neural tube (NT, red) are in close contact. Dorsal is up. (e) Magnified view of purple-boxed area in (d), showing direct contact of vessels with nerves at the neurovascular interface (blue arrowheads) and flt1 expressing neurons with long axonal extensions in the neural tube (white arrowheads). (f) Magnified view of blue-boxed area in (d) showing flt1 expressing neurons (arrowheads) and their axons inside neural tube (red). (g) Lateral view of TgBAC(flt1:YFP)hu4624; Tg(Xla.Tubb:DsRed)zf148 at the level of the neural tube showing flt1 expressing neurons (arrowheads) in neural tube. DA, dorsal aorta; dpf, days post fertilization; DLAV, dorsal longitudinal anastomotic vessel; hpf, hours post fertilization; ISV, intersegmental vessel; NC, notochord; NT, neural tube; PCV, posterior cardinal vein. Scale bar, 30 μm in a–d,g; 10 μm in e,f.