
|
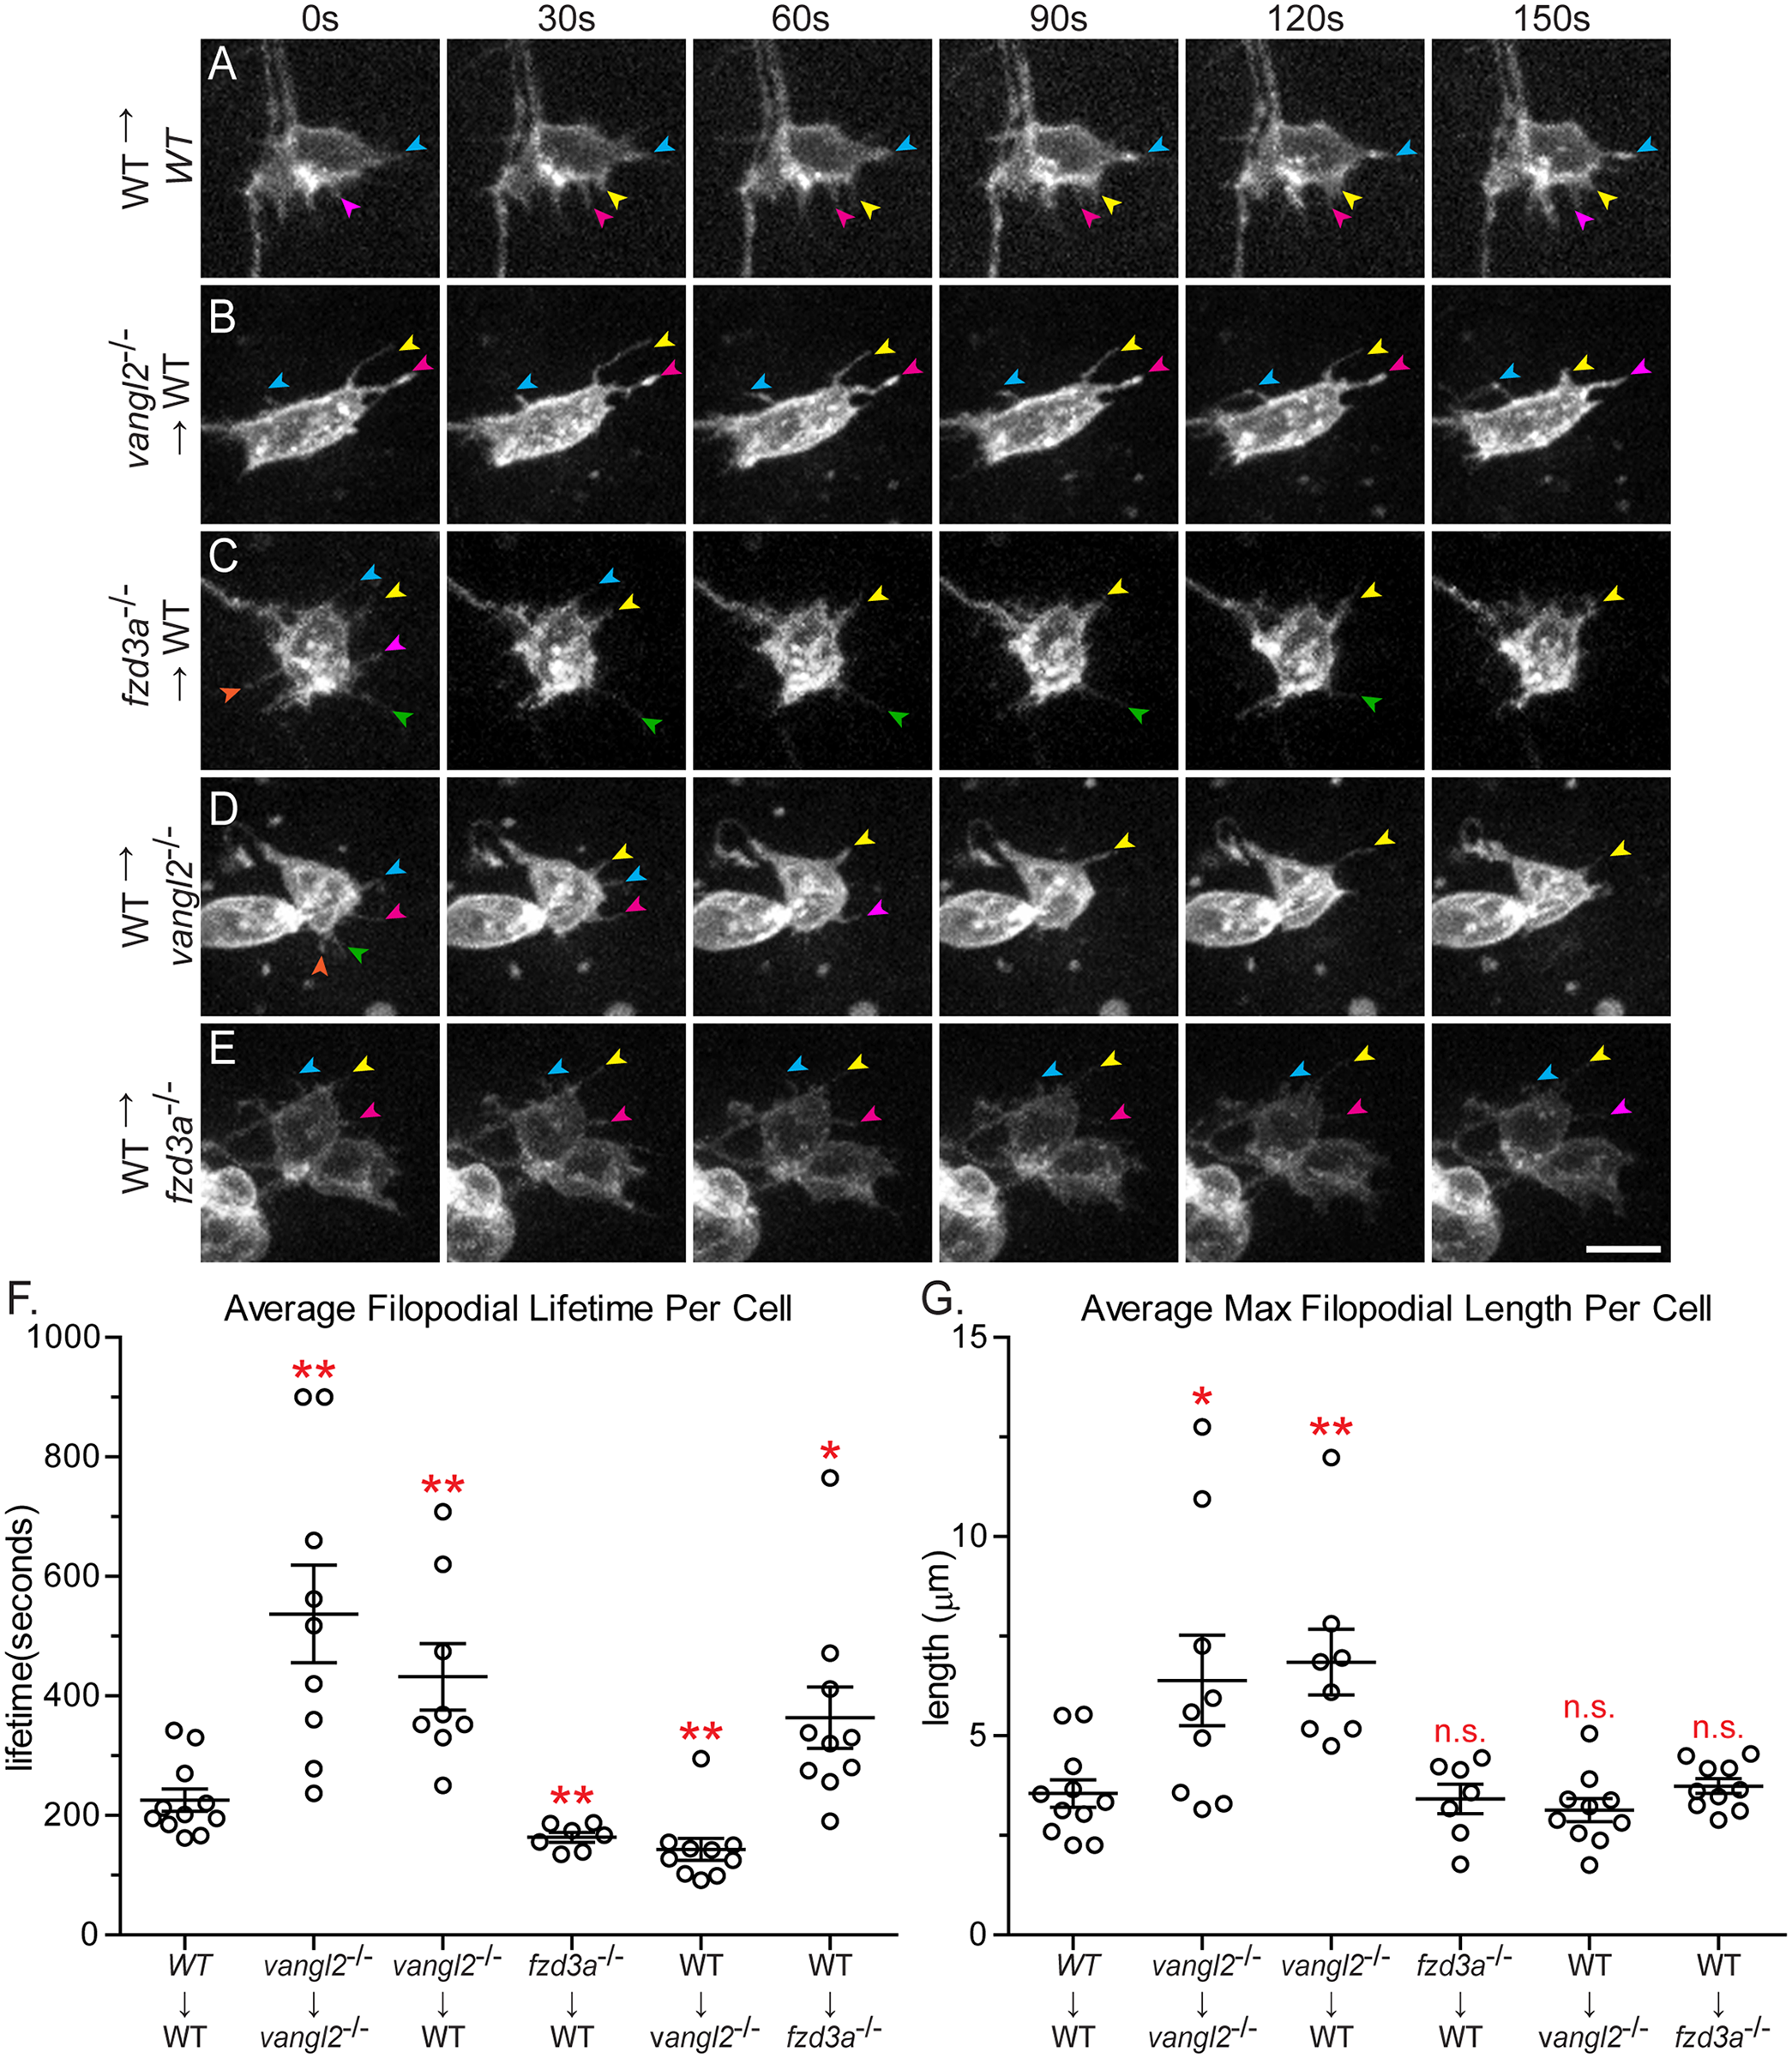
Fig. 6
Vangl2 and Fzd3a have opposing cell-autonomous and non-cell-autonomous roles in modulating filopodial dynamics.
(A-E) Time-lapse spinning-disc confocal series of donor-derived FBMNs in chimeric embryos at 24–30 hours post-fertilization (hpf). Transplant conditions are indicated on the left as donor→host. Colored arrows indicate individual filopodia at different time-points. Anterior is to the top and medial is to the right. Scale bar: 5 μm. (F) Quantitation of filopodial lifetime for donor-derived FBMNs. Each data point is an average of all the filopodial lifetimes for one FBMN. (G) Quantitation of the maximum filopodial length for donor-derived FBMNs. Each data point is the average maximum length for all the filopodia of one FBMN. WT→WT: N = 6 embryos, 11 neurons (3 in r4, 4 in r5, 4 in r6), 70 filopodia; vangl2-/-→vangl2-/-: N = 6 embryos, 9 neurons, 43 filopodia; vangl2-/-→WT: N = 6 embryos, 8 neurons, 44 filopodia; fzd3a-/-→WT: N = 7 embryos, 7 neurons, 73 filopodia; WT→ vangl2-/-: N = 8 embryos, 10 neurons, 152 filopodia; WT→ fzd3a-/-: N = 6 embryos, 10 neurons, 65 filopodia. Graphs represent data as mean ± SEM. *p<0.05, **p<0.01 compared to WT→WT control; n.s., not significant. Significance was determined using an unpaired, two-tail t-test with Welch’s correction.