
|
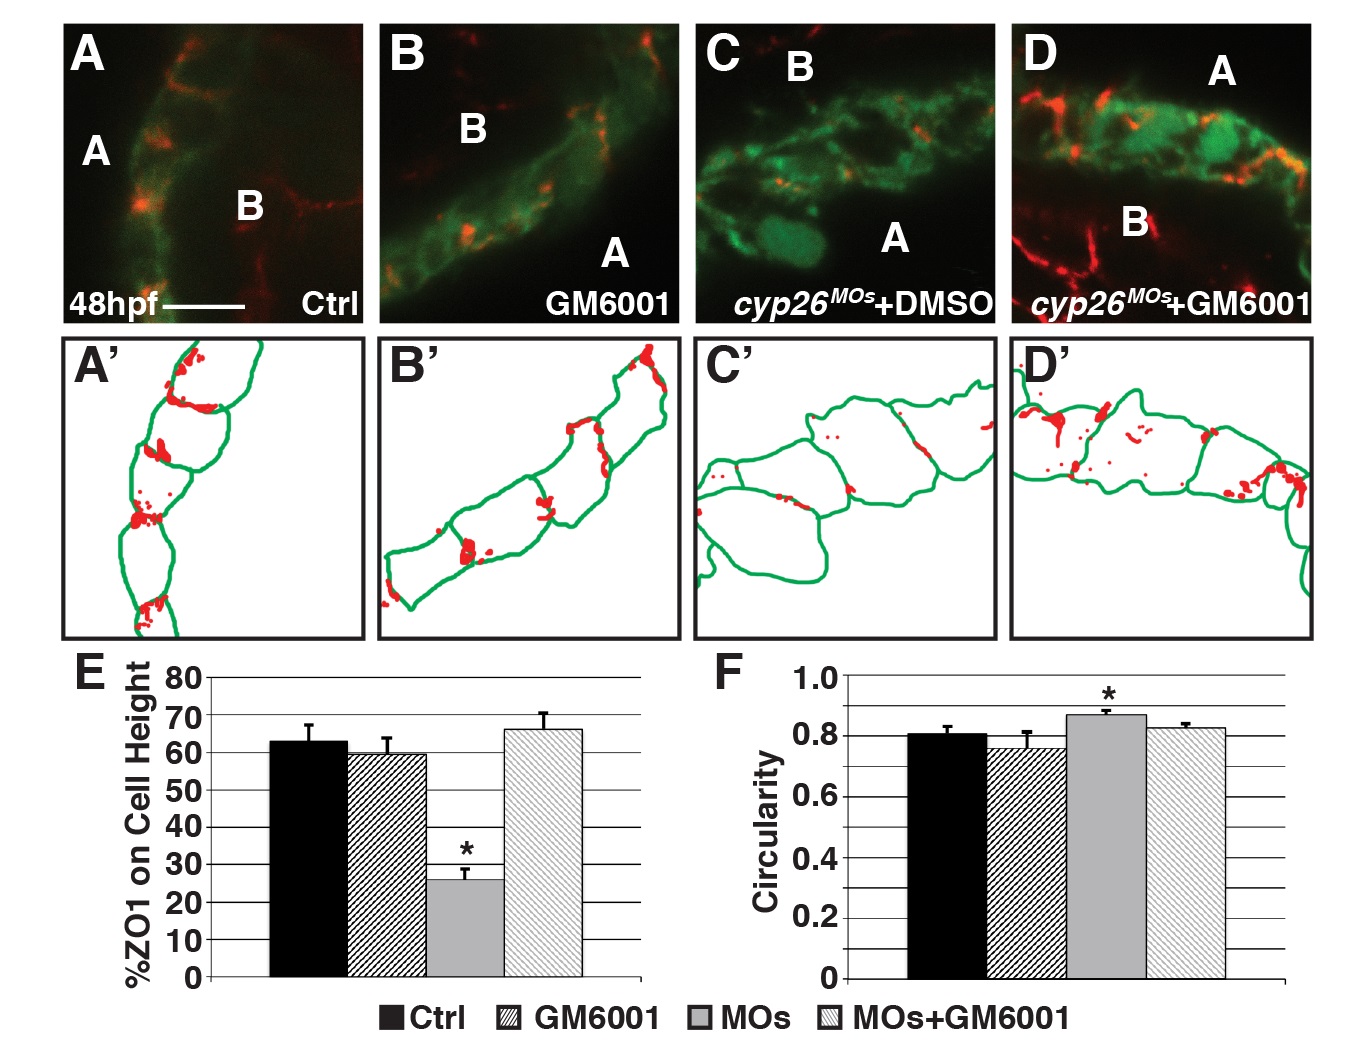
Fig. S10
GM6001 treatment restore ventricular cardiomyocyte polarity and shape in Cyp26-deficient embryos.
(A-D) Confocal images of IHC of control (DMSO treated), GM6001 treated, Cyp26-deficient DMSO treated, Cyp26-deficient GM6001 treated Tg(myl7:EGFP) embryos stained for ZO1 (red) and GFP (green). (A’-D’) Schematized outlines of cell boundaries and ZO1 staining for images in A-D. (E) Graph depicting the percentage of ZO1 expression along the height of cardiomyocytes. (F) Graph depicting circularity measurement of ventricular cells. For E and F, control n = 18, GM6001 treated n = 15, Cyp26-deficient n = 21, Cyp26-deficient + GM6001 treated n = 21. Error bars are SEM, asterisks denote p<0.05 by Student’s t-test compared to controls. Lateral views, anterior right (A-D). A, apical; B, basal. Scale bars: 25 mm.