
|
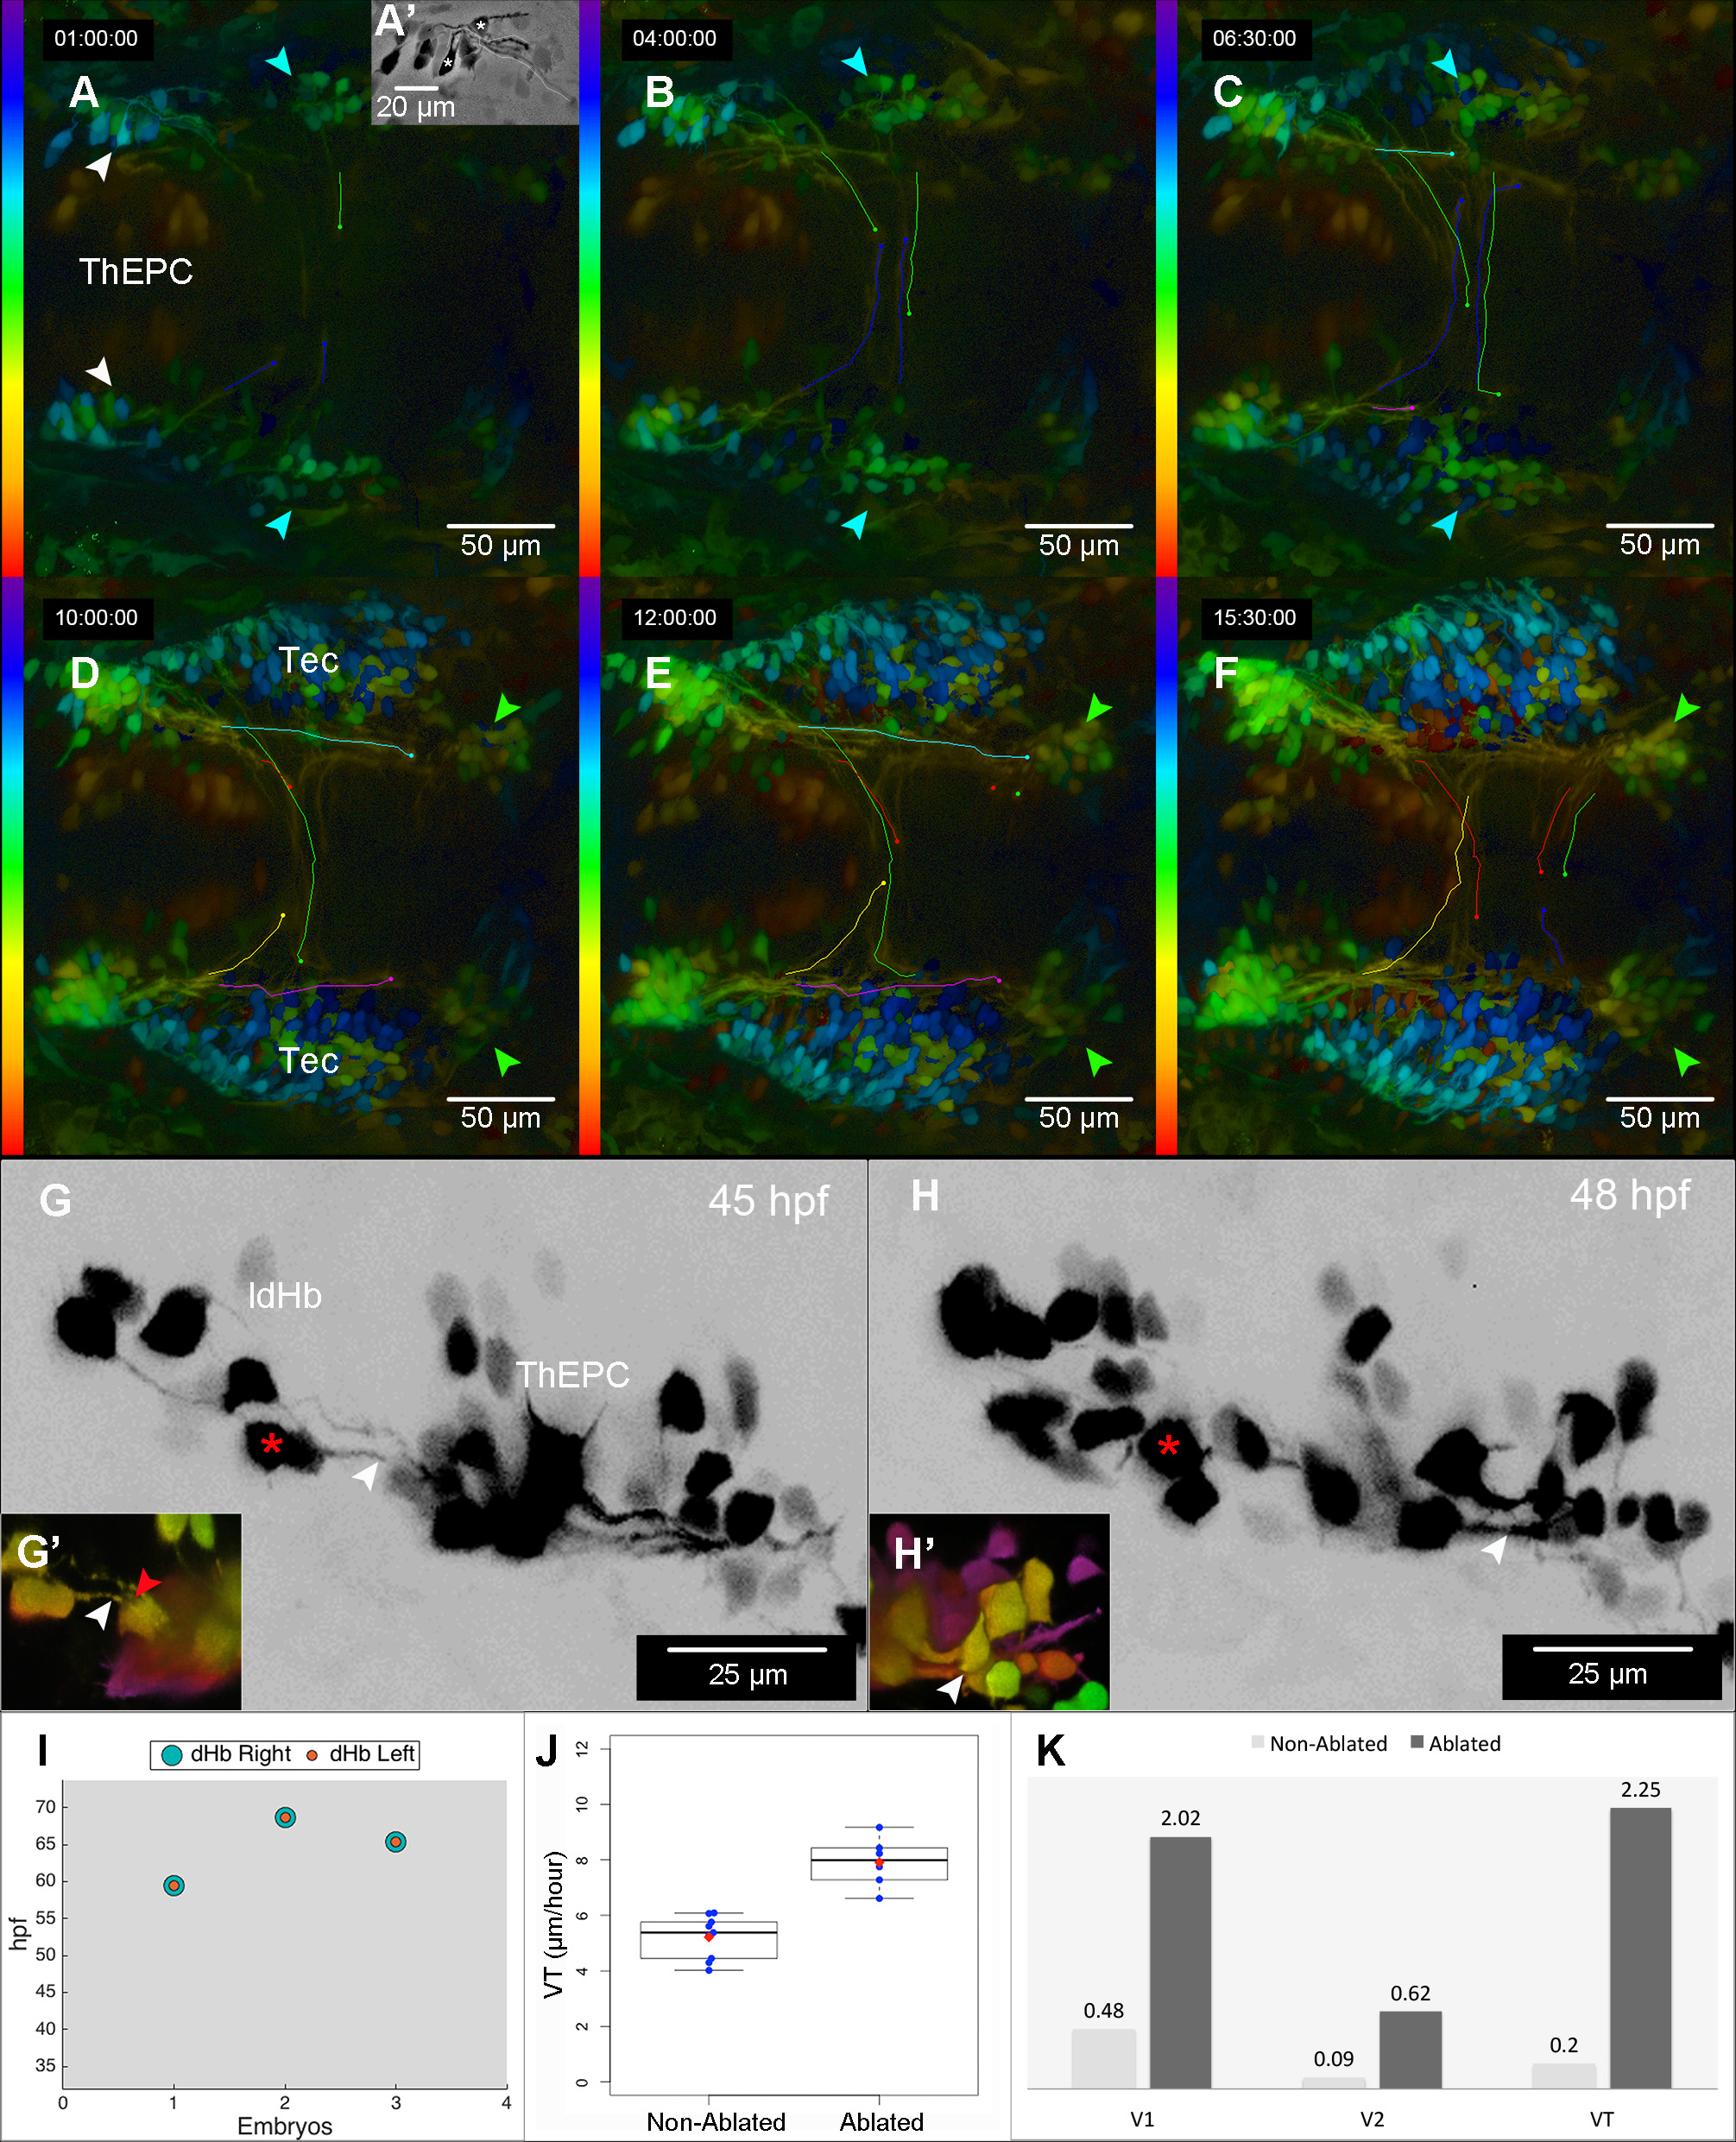
Fig. S2
Axon tracking.
(A-F) Dorsal view, anterior to the left, colour coded MIP obtained from a total z-height of 301 μm focussed on ThEPC axons in an Et(-1.0otpa:mmGFP)hd1 embryo. Time points between 33 hpf and 49.5 hpf. The LUT shows the Z colour code table according to the depth of each stack. Original stacks were cropped and the gamma was adjusted for display purposes. White arrowheads show the location of ThEPCs at 33 hpf; blue and green arrowheads mark two posterior bilateral clusters of projection neurons. Manual tracking was performed using the Fiji manual tracking plugin, the overlay of dots and lines was used to highlight the position of ThEPC axons and axons originating from the second and third cluster of neurons. (A') ThEPC neurons at 32 hpf shortly after initiation of axon extension (white lines), two of which form commissures (asterisks). The axon of the lower marked neuron is tracked in green (A-E). (G-H') Lateral views, anterior to the left, focussed on the left ThEPC at developmental stages indicated. White arrowheads mark one dHb axon originating from a dHb neuron (asterisk). (G') Red arrowhead points at a potential contact between the dHb axon and a ThEPC neuron. (G, H) Original stacks were cropped and adjusted using difference of Gaussians. The LUT was inverted. (G', H') The stack is displayed in 3D using the alpha blending function in NIS Elements software (Nikon) and reoriented in xyz. The image was cropped and the 3D depth colour code applied to better visualise the structures of interests localised in the same focal plane. (I) Graphic illustration of dHb axons reaching the IPN at the same time in three embryos. Note that the time (hpf) is arbitrary as the visualisation of dHb axons at the IPN before innervation depends on the mounting orientation of the embryo. (J) Boxplots of axon velocities analysed in Fig. 2. The axon VT is significantly higher on the ablated side compared to the nonablated side. Red diamonds indicate the mean values. Shapiro-Wilk normality test for the non-ablated side (n = 9): W = 0.8974, p-value = 0.2373, and ablated side (n = 6): W = 0.9931, p-value = 0.9954. Welch Two Sample t-test: t = -5.9783, df = 9.687, pvalue = 0.0001548. (K) Statistical analysis of the effect size of ThEPC ablations on dHb axon velocity. Compared are the velocities of left and right axons in non-ablated and unilaterally ThEPC ablated conditions. The Cohen's distance analysis used corresponds to the distance in standard deviations between the mean value of dHb axon velocities. Values between 0 and 0.2 standard deviations indicate a small effect, 0.2 to 0.5 represent a medium effect and values bigger than 0.5 indicate a large effect. ldHb, left dosal habenula; LUT, Look Up Table; ThEPC, thalamic-epithalamic early projecting cluster.