
|
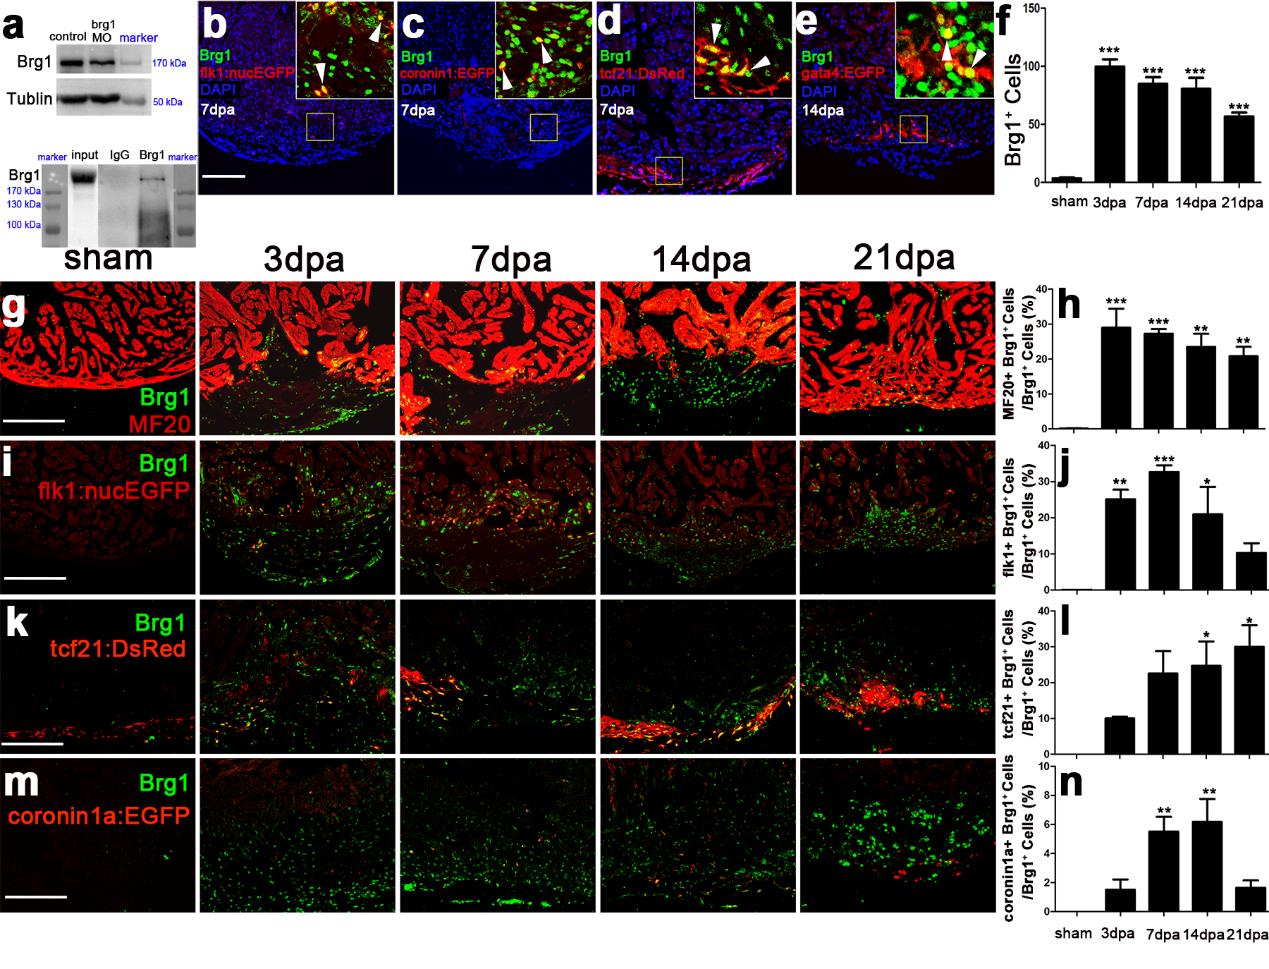
Fig. S2
Brg1 is activated in multiple types of cells during cardiac regeneration. (a) Upper panel, western blot with anti-Brg1 antibody showing that Brg1 decreased in brg1 morphant embryos compared with control embryos at 48 hpf. Tubulin served as a loading control. Lower panel, Immunoprecipitation (IP) by anti-Brg1 antibody showing that Brg1 antibody was able to pull down the endogenous Brg1 of adult zebrafish hearts at 7 dpa. (b-e) Immunostaining of Brg1 and EGFP or DsRed on paraffin sections of injured hearts, in which the endocardium/endothelium were labeled by Tg(flk1:nucEGFP) at 7 dpa (b), macrophages and neutrophils by Tg(coronin1a:EGFP) at 7 dpa (c), the epicardium by Tg(tcf21:DsRes) at 7dpa (d), and the myocardium by Tg(gata4:EGFP) at 14 dpa (e). In the upper-right corners of panels b-e, higher magnification images show that Brg1 was located in the endocardium (b), macrophages/neutrophils (c), the epicardium (d), and the myocardium (e). (f) Quantification of Brg1-positive cells of sham and injured hearts from 3 to 21 dpa. (g-n) Immunostaining of Brg1 and MF20 (g), Brg1 and flk1:nucEGFP (i), Brg1 and tcf21:DsRed (k), as well as Brg1 and coronin1a:EGFP (m) of sham and injured hearts from 3 to 21 dpa. Quantification of Brg1+ cells co-expressing MF20 (h), Brg1+ cells co-expressing flk1:nucEGFP (j), Brg1+ cells co-expressing tcf21:DsRed (i), and Brg1+ cells co-expressing coronin1a:EGFP (n). Scale bars,100 μm. For all quantifications, data are mean ± s.e.m.; one-way ANOVA followed by Dunnett’s Multiple Comparison Test, *p <0.05, **p <0.01, ***p <0.001