
|
Fig. 5
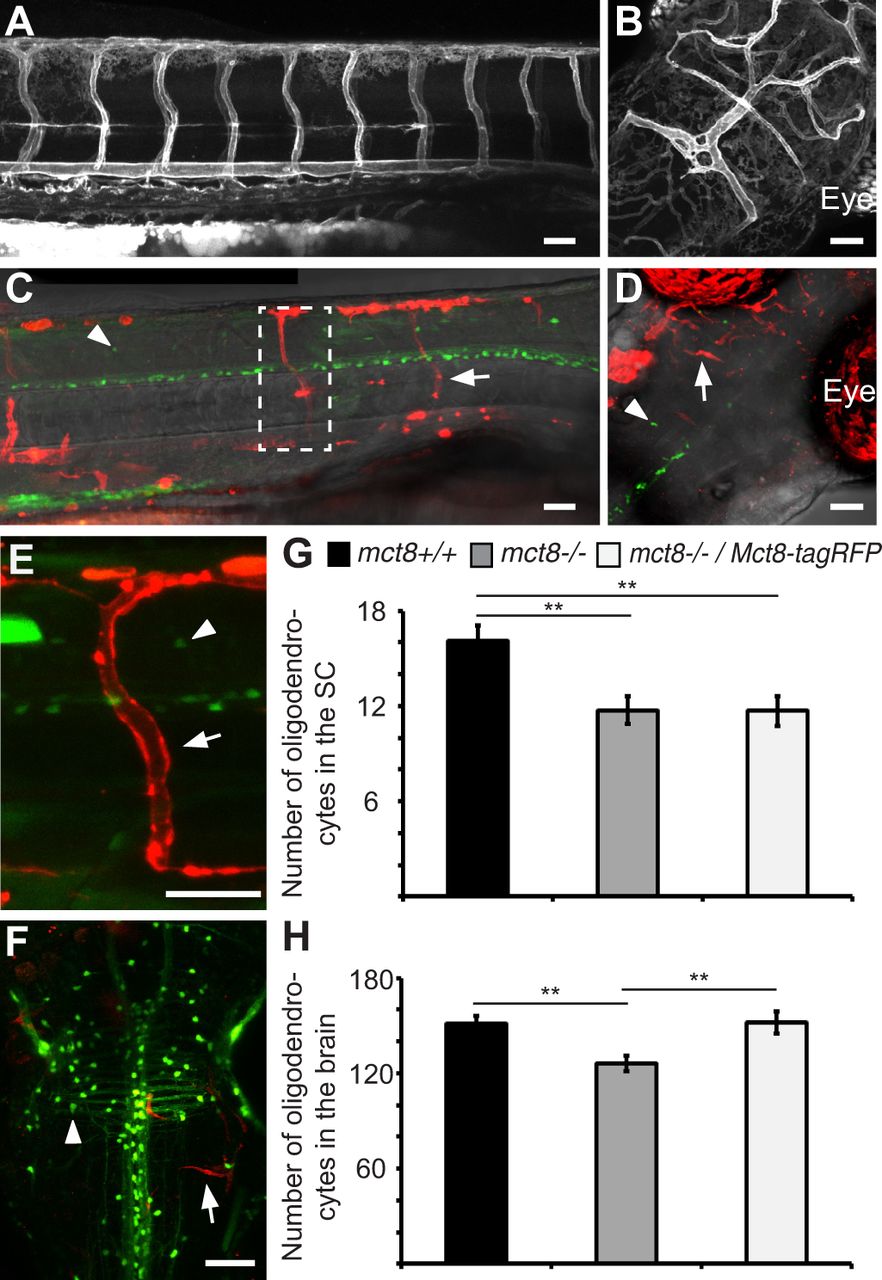
Specific expression of Mct8 in the vascular system and BBB rescues the number of oligodendrocytes in the brain. (A,B) Lateral view of the trunk (A, head pointing to the right) and dorsal view of the head (B) of a tg(fli:Mct8-EGFP) 3-dpf embryo. (C-F) Lateral view of the trunk (C,E, head pointing to the right) and dorsal view of the head (D,F) of a tg(mbp:EGFP) larvae injected with fli:Mct8-tagRFP. Arrows indicate the expression of Mct8-tagRFP in the endothelial cells of the vascular system, and arrowheads indicate oligodendrocytes in the CNS. Wide (C) and high-magnification (dashed box in C, E) views in 3-dpf larvae show red mosaic expression of Mct8-tagRFP and green oligodendrocytes. Dorsal view of the head shows green oligodendrocytes in the brain and mosaic expression of Mct8-tagRFP in 3 (D)- and 10 (F)-dpf larvae. (G) Number of oligodendrocytes counted in the spinal cord (SC) of 3-dpf larvae (mct8+/+: n=37, mct8−/−: n=42 and mct8−/−/Mct8-tagRFP: n=26, **P<0.01). (H) Number of oligodendrocytes counted in the brain of 10-dpf larvae (mct8+/+: n=10, mct8−/−: n=10 and mct8−/−/Mct8-tagRFP: n=11, **P<0.01). Values represented as means±s.e.m. Statistical significance determined by one-way ANOVA followed by post-hoc Tukey HSD test (**P<0.01). Scale bars: 50 µm.