
|
Fig. S1
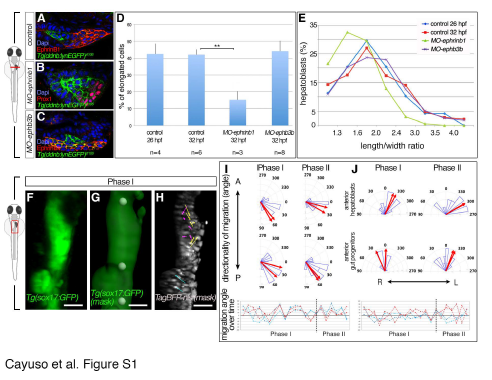
Hepatoblasts undergo dynamic cell shape changes during liver budding. Related to Figure 1.
(A-C) Cell morphology was determined with EphrinB1- or Tg(-0.8cldnb:lynEGFP)zf106-expression outlining the hepatoblasts in control (A), MO-ephrinB1 (B) and MO-ephB3b embryos (C); transverse sections with liver oriented to the right. Morphometric measurements were carried out on serial sections through the bud. (D,E) Quantification of hepatoblast characteristics during liver budding in control, MO-ephrinB1 and MO-ephB3b embryos: (D) population of elongated cells (length/width>2) per bud and (E) hepatoblast distribution according to length/width ratio; only MO-ephrinB1M exhibit a significantly decreased length/width ratio). Error bars represent standard error of the mean; ** = p<0.01. (F-H) Processing steps of 4D dataset of a Tg(sox17:GFP)z99 embryo injected with tagBFP-nls mRNA capturing liver budding (see Figure 1J-N, movie S1). sox17:GFP expression (F) marks the endoderm and was used to generate a foregut mask (G) which was subsequently applied to the TagBFP-nls channel (H). Three manually selected anatomical landmarks in 3D were used for drift correction (G, round spheres). Scale bar - 40μm. (I,J) Rose plots represent distribution of angular displacement (blue sectors) for hepatoblasts and gut progenitors from the same anterior position and angle of mean displacement per cell for the entire period (red arrow). Displacements were recorded every 28 min with respect to the embryonic midline and left-right distribution. Line plots representing directionality of displacement over time reveal differences in individual angular cell displacement for various hepatoblasts (red hues) and gut progenitors (blue hues). Data are derived from movie S1 (see also Figure 1 J-N).
Reprinted from Developmental Cell, 39, Cayuso, J., Dzementsei, A., Fischer, J.C., Karemore, G., Caviglia, S., Bartholdson, J., Wright, G.J., Ober, E.A., EphrinB1/EphB3b Coordinate Bidirectional Epithelial-Mesenchymal Interactions Controlling Liver Morphogenesis and Laterality, 316-328, Copyright (2016) with permission from Elsevier. Full text @ Dev. Cell