
|
Fig. 7
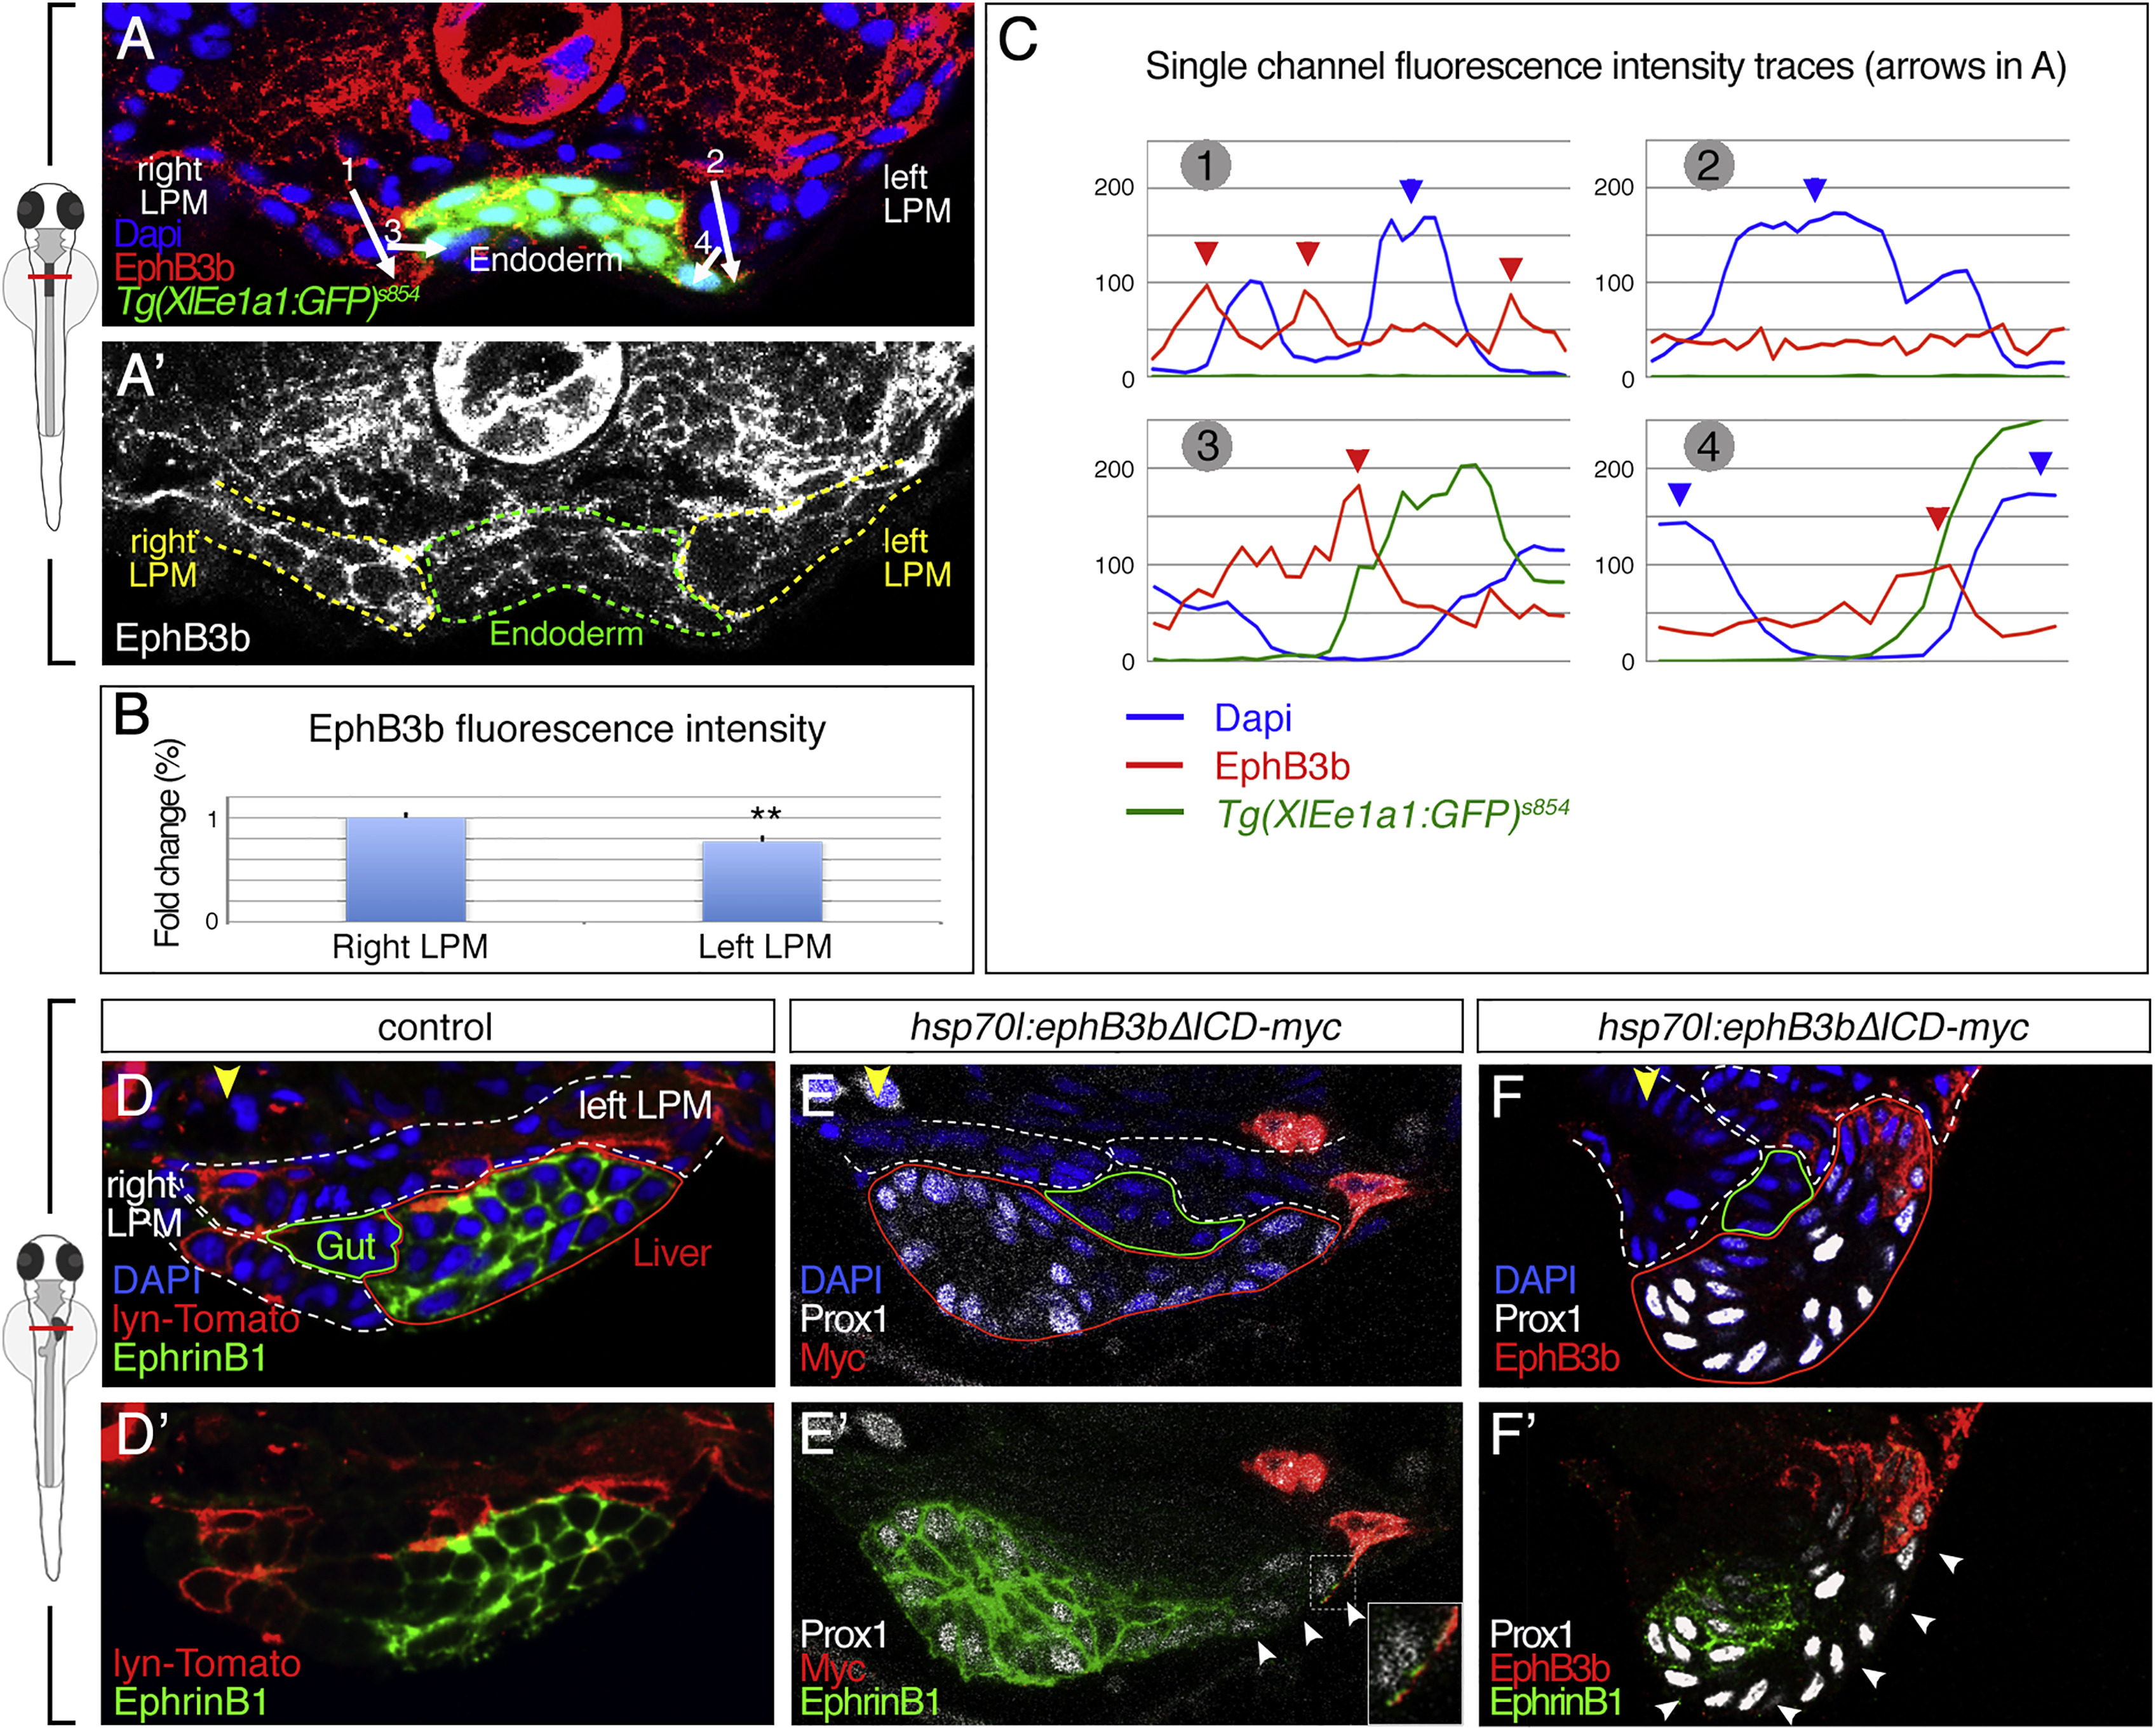
Asymmetric EphB3b Can Exert Repulsive Activity during Liver Budding
(A-C) EphB3b expression is higher on the right than the left LPM at 24 hpf (A and A′). Quantification of EphB3b expression measuring overall fluorescent intensity (B) and intensity profile (C). Fluorescent intensity profiles show high EphB3b at cell membranes (red arrowheads) of the right but not left LPM; numbered arrows in (A) indicate the position of profiles. The right LPM-hepatoblast interface (profile 3) shows highest EphB3b expression. High DAPI levels indicate nuclei position (blue arrowheads).
(D-F) Ectopic EphB3bΔICD expression alters hepatoblast position. Compared with mosaic lyn-Tomato (D), mosaic EphB3bΔICD expression on the left LPM (E) or left LPM and hepatoblasts (F) at 26 hpf causes positioning of Prox1+ hepatoblasts away from the clone at 32 hpf. EphrinB1 is absent from membranes in 3-7 hepatoblasts next to EphB3bΔICD clones (white arrowheads), without altering Prox1 expression (E′ and F′). (E′) Inset shows an EphrinB1 signal in EphB3bΔICD protrusion, indicating direct cell interaction. (A, A′ and D–F′) Transverse sections at liver level, left side to the right; yellow arrowhead specifies the midline; lines delineate the left and right LPM (white), gut (green), hepatoblasts (red).
∗∗p < 0.01. See also Figures S4 and S5.
Reprinted from Developmental Cell, 39, Cayuso, J., Dzementsei, A., Fischer, J.C., Karemore, G., Caviglia, S., Bartholdson, J., Wright, G.J., Ober, E.A., EphrinB1/EphB3b Coordinate Bidirectional Epithelial-Mesenchymal Interactions Controlling Liver Morphogenesis and Laterality, 316-328, Copyright (2016) with permission from Elsevier. Full text @ Dev. Cell