
|
Fig. 6
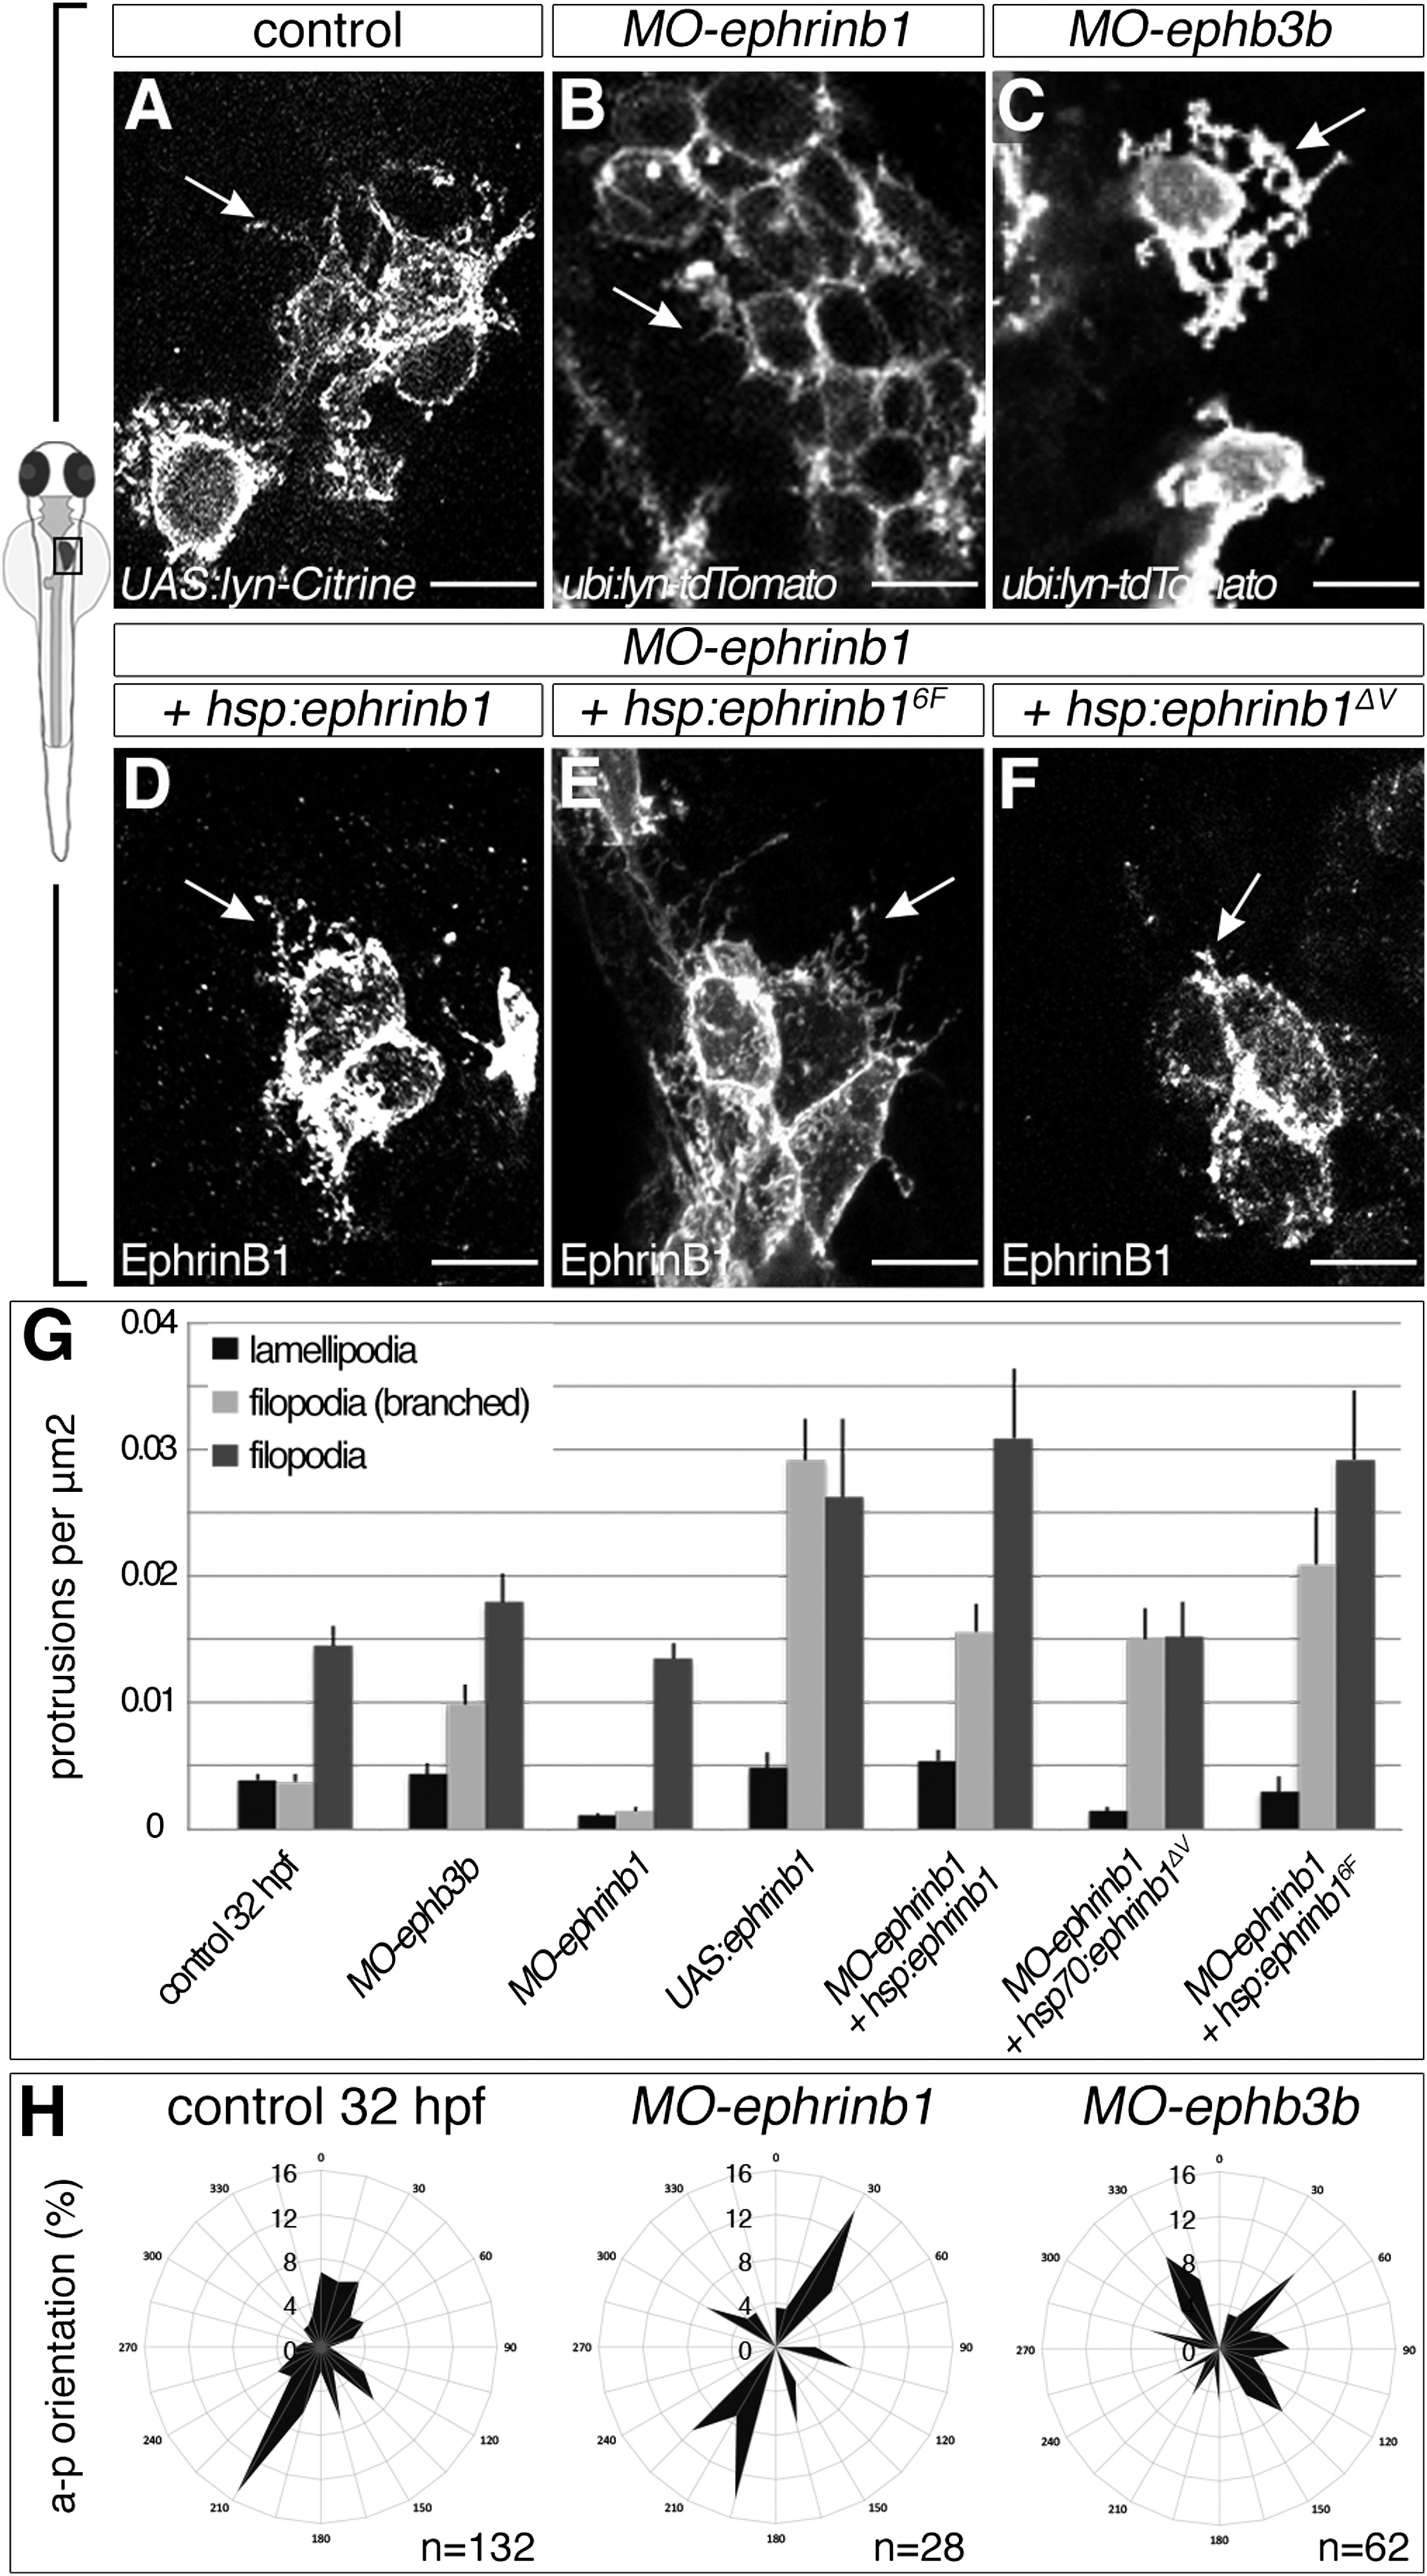
Opposing EphrinB1 and EphB3b Functions Control Formation of Hepatoblast Protrusions
(A-G) EphrinB1 and EphB3b regulate hepatoblast protrusion number and morphology. Sparse labeling reveals fewer and shorter filopodia in MO-ephrinb1 hepatoblasts than in controls (A and B). Conversely, MO-ephb3b hepatoblasts show more complex, branched extensions (C). In contrast to EphrinB1 and EphrinB16F (D and E), EphrinB1ΔV fails to rescue extension formation in MO-ephrinb1 (F). Arrows indicate representative protrusions (A-F). Quantification of hepatoblast protrusion types in various conditions; comparative p values are shown in Table S1 (G).
(H) Hepatoblast lamellipodia orientation is randomized in MO-ephb3b.
(A-C) lyn-Citrine and lyn-Tomato outline hepatoblasts, (D-F) EphrinB1 staining highlights overexpression of different forms of EphrinB1, (A-F) ventral projections, anterior to the top. SEs are shown. Scale bars represent 10 μm. See also Figure S3;Table S1.
Reprinted from Developmental Cell, 39, Cayuso, J., Dzementsei, A., Fischer, J.C., Karemore, G., Caviglia, S., Bartholdson, J., Wright, G.J., Ober, E.A., EphrinB1/EphB3b Coordinate Bidirectional Epithelial-Mesenchymal Interactions Controlling Liver Morphogenesis and Laterality, 316-328, Copyright (2016) with permission from Elsevier. Full text @ Dev. Cell