
Fig. 2
|
Fig. 2
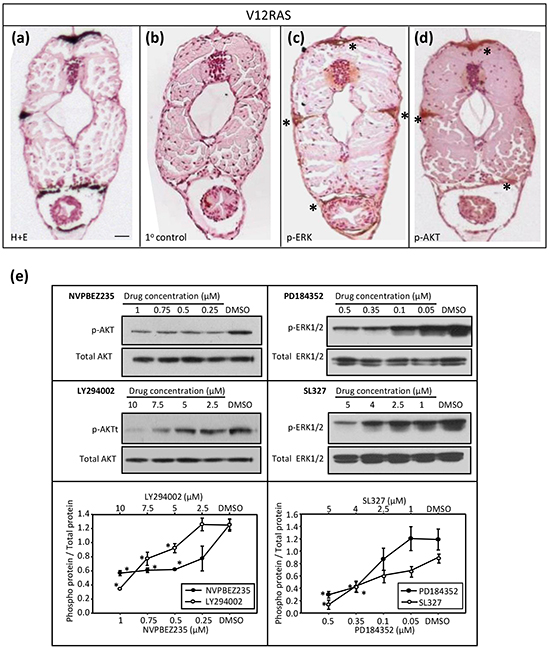
Molecular characterization of the V12RAS model. a–d. Transverse sections of V12RAS larvae. (a) H&E staining. Scale bar = 0.2 mm. (b–d) IHC on bleached sections. (b) Non-specific primary control, (c) phospho-ERK and (d) phospho-Akt. Positive stain (brown) denoted by asterisks. e. Results of immunoblotting protein extract (30 μg) from 30 pooled 5-dpf embryos exposed for 4 h to the specified drug at the indicated concentrations. Representative immunoblots are depicted with densitometric quantification shown immediately below (mean p-protein/total protein ± SEM for three independent experiments). *P<0.05 compared to vehicle control; independent samples t-test.