
|
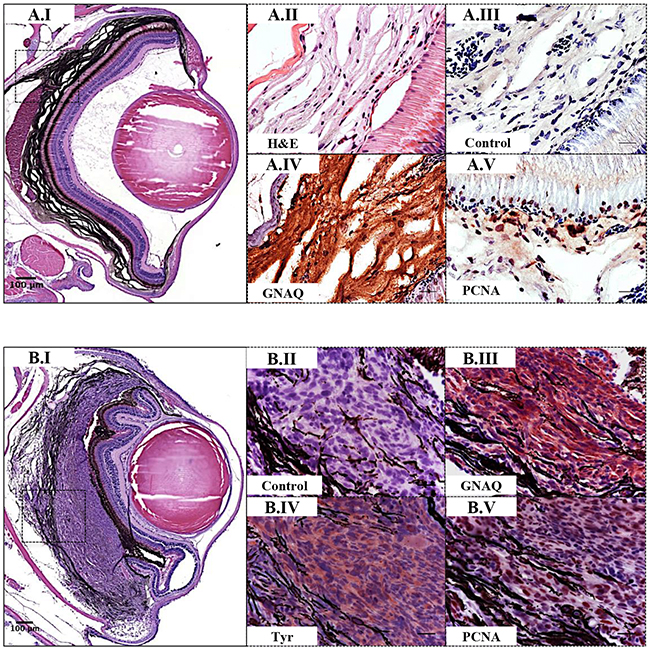
Fig. 5
Validation of GNAQQ209P-driven choroidal hyperplasia and uveal tumours in Tg (mitfa:GNAQQ209P;p53M214K/M214K) zebrafish. Transverse sections of formalin-fixed and paraffin-embedded zebrafish eye tissues were stained by IHC, visualized by ImmPact NovaRed peroxidase (HRP) substrate then counterstained with hematoxylin (blue). Representative H&E and IHC images are shown for the pre-malignant A.I-A.V. and malignant B.I-B.V. stages. (A.I) H&E staining illustrating a 5x magnification of a benign choroidal hyperplasia in a 2-month-old Tg (mitfa:GNAQQ209P;p53M214K/M214K) zebrafish. (A.II-A.V) Magnifications of the region depicted in the black dashed box in A.I. (A.II) H&E staining of a melanin-bleached section, revealing multiple cellular layers of the thickened choroid. (A.III) Negative control section for IHC staining. (A.IV) GNAQ expression in thickened choroid. (A.V) Hyperplastic choroidal melanocytes are positive for PCNA (dark brown nuclei), especially at the junctional zone between RPE and choroid. (B.I) H&E staining illustrating a 5x magnification of a uveal tumour developing in a 5-month-old Tg (mitfa:GNAQQ209P;p53M214K/M214K) zebrafish. (B.II) Negative control section for IHC staining. (B.III) Malignant cells expressing GNAQ. (B.IV) Positive immunoreactivity to the melanocytic differentiation marker tyrosinase, indicating the melanocytic origin of malignant cells. (B.V) Numerous PCNA-positive nuclei (dark brown) in malignant melanocytes. Abbreviations: Tyr, tyrosinase; PCNA, proliferating cell nuclear antigen. Scale bars, 100 μm (A.I, B.I); 20 μm (A.II-A.V; B.II-B.V).