
|
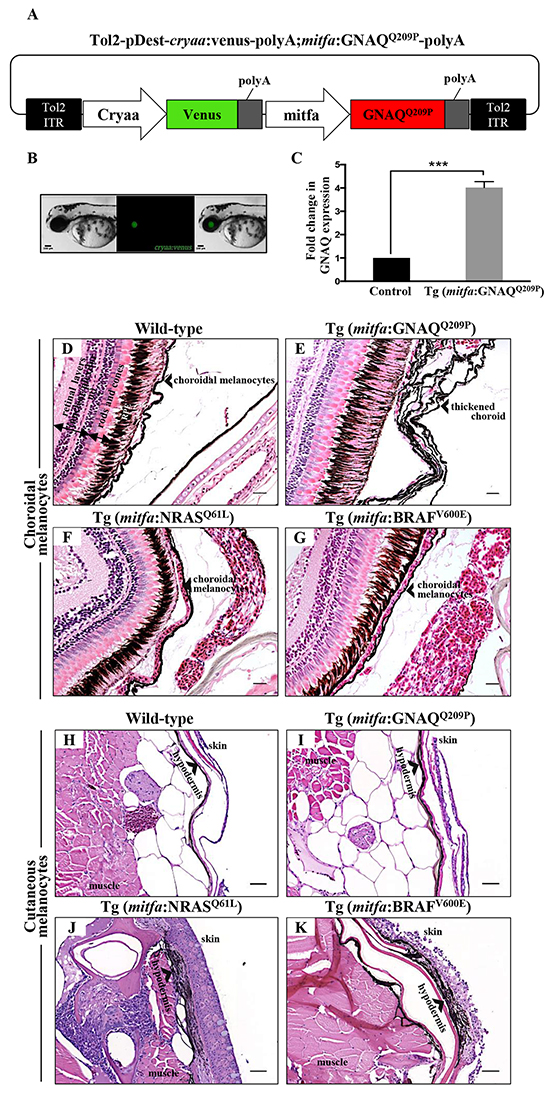
Fig. 1
Only oncogenic GNAQQ209P is sufficient to induce choroidal melanocyte hyperplasia. A. Schematic representation of elements in the Tol2-based transposon vector driving the expression of oncogenic GNAQQ209P under the control of zebrafish mitfa promoter in the melanocyte lineage and Venus fluorescent reporter under the control of cryaa promoter in the eye lens. Abbreviations: ITR, inverted terminal repeat. B. Example of a 5 dpf transgenic zebrafish embryo with a fluorescent eye lens. Scale bar, 100 μm. C. RT-qPCR data showing a 4.1 fold increase in GNAQ expression in the melanocytes of 2-month-old F1 Tg (mitfa:GNAQQ209P) zebrafish, as compared to non-injected controls. Data represents mean ± SEM of triplicates of three independent experiments. *** P <0.05 using two-tailed, unpaired t test. D, E, F, G. H&E staining of transverse sections of formalin-fixed and paraffin-embedded eye specimens of control wild-type, Tg (mitfa:GNAQQ209P), Tg (mitfa:NRASQ61L), and Tg (mitfa:BRAFV600E) zebrafish, respectively. Choroidal hyperplasia observed in the thickened choroid (E; black arrowhead) was only observed in transgenic animals expressing oncogenic GNAQQ209P. In contrast, as compared to control wild-type H. and Tg (mitfa:GNAQQ209P) I. hyperplasia of cutaneous melanocytes (black arrowhead) was only detected in transverse sections of the torso region of Tg (mitfa:NRASQ61L) J. and Tg (mitfa:BRAFV600E) K. zebrafish. Abbreviations: RPE, retinal pigmented epithelium. Scale bars, 20 μm.