
Image
|
Figure Caption
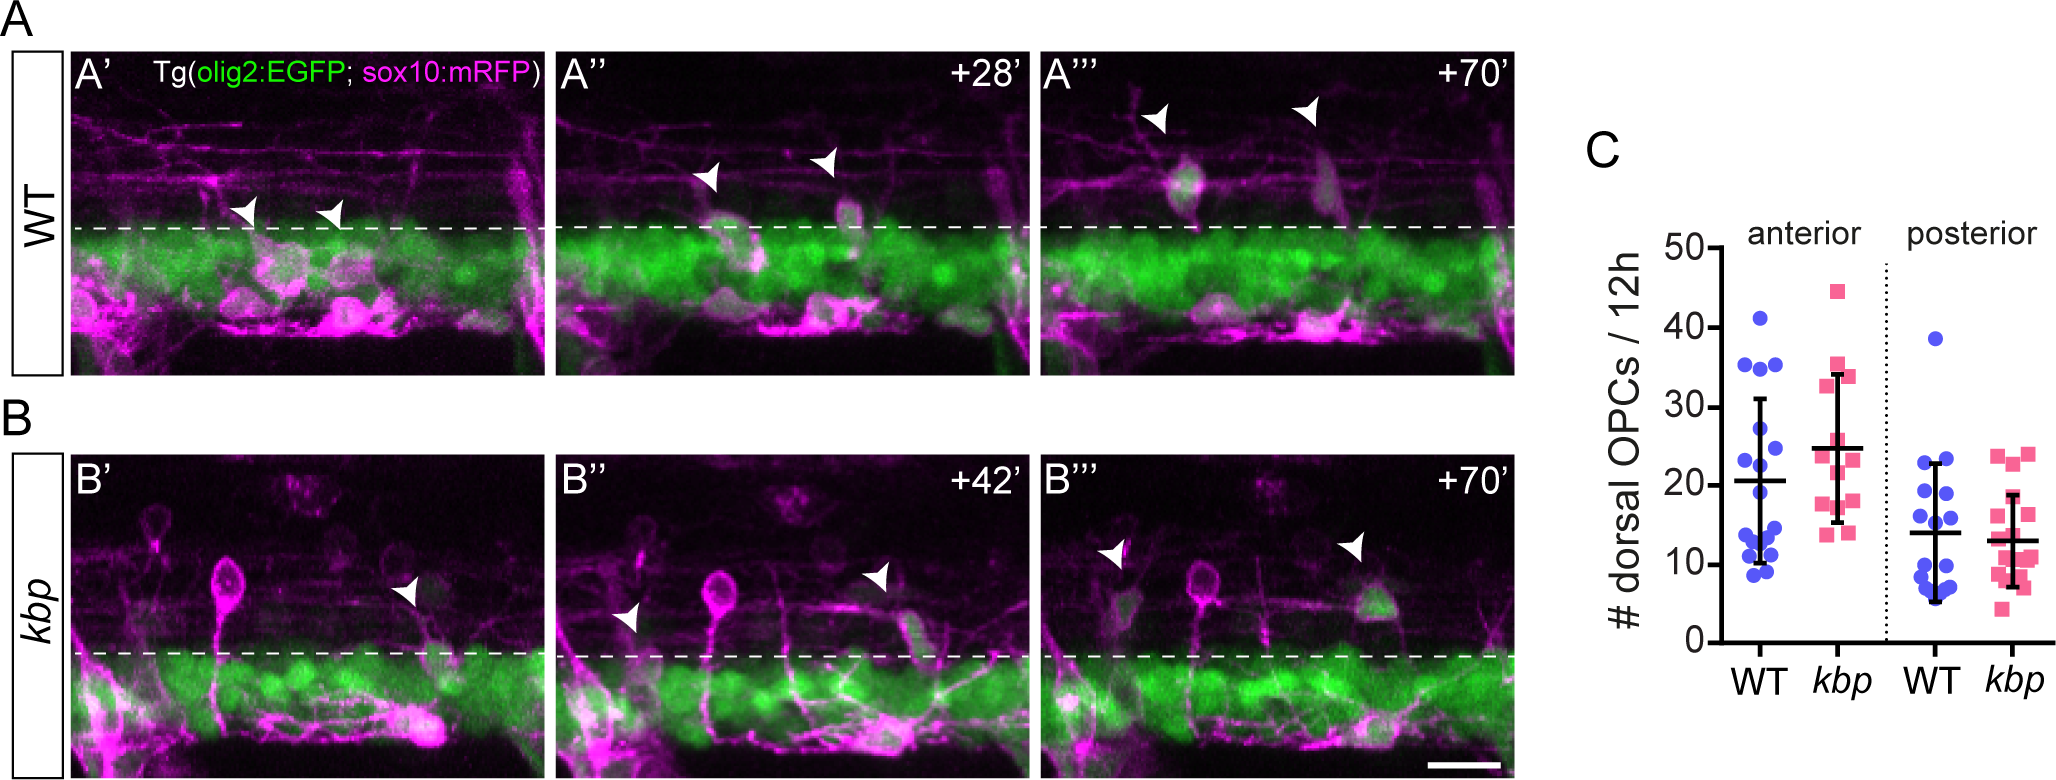
Fig. 7
OPCs migrate dorsally normally despite reduction in reticulospinal axons.
A, B, Time-lapse stills of Tg(olig2:EGFP; sox10:mRFP), WT (A) or kbp mutant (B) larvae, showing two OPCs (arrowheads) migrating dorsally above the olig2:EGFP band of motor neurons and pMN precursors (dashed line). Scale bar: 10μm. C, The rate at which OPCs accumulate in the dorsal spinal cord is similar between WTs and mutants in 425μm long regions. Data from N = 18 WT and N = 13 mutants (anterior) and N = 17 WT and N = 19 mutants (posterior). Error bars indicate ± SD.
Figure Data
Acknowledgments
This image is the copyrighted work of the attributed author or publisher, and
ZFIN has permission only to display this image to its users.
Additional permissions should be obtained from the applicable author or publisher of the image.
Full text @ PLoS One