
|
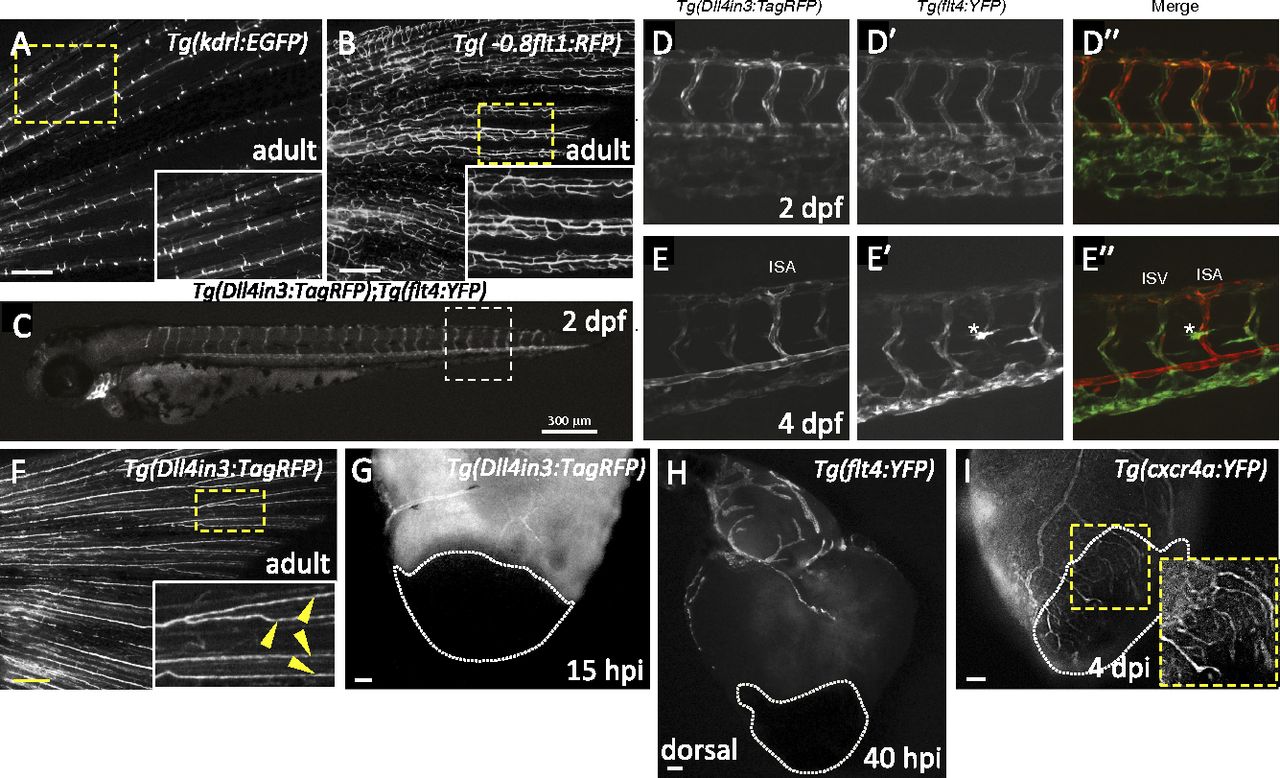
Fig. S3
Expression patterns of different arterial and venous markers at different developmental stages and after injury. (A and B) Images of Tg(kdrl:EGFP) (n = 4) and Tg(-0.8flt1:RFP) (n = 4) adult caudal fins. Insets show high-magnification images of the fin rays displaying Tg(kdrl:EGFP) expression only in the medial arteries (A), or Tg(-0.8flt1:RFP) (B) expression in arteries and veins. (C) At 2 dpf, Tg(Dll4in3:TagRFP) expression is visible throughout the arterial endothelium, the dorsal aorta, intersegmental vessels, endocardium, branchial arch arteries, and cranial arterial endothelium. (D and E) Detailed views of posterior body segments of Tg(Dll4in3:TagRFP) (an arterial-specific EC reporter) and Tg(flt4:YFP) (a venous and lymphatic EC-specific reporter) animals. At 2 dpf, Tg(Dll4in3:TagRFP) expression is clearly restricted to the dorsal aorta, but is also present in all intersegmental vessels (D). Tg(flt4:YFP) is preferentially expressed in the vein plexus, but coexpressed with Tg(Dll4in3:TagRFP) in intersegmental vessels and the dorsal aorta (D′). At 4 dpf, arterial Tg(Dll4in3:TagRFP) and venous Tg(flt4:YFP) expression are mutually exclusive (E and E′). In the trunk, Tg(Dll4in3:TagRFP) expression is restricted to the dorsal aorta and to intersegmental vessels that by now have become specified as arterial (E). In contrast, Tg(flt4:YFP) expression is only observed in the posterior cardinal vein and venous intersegmental vessels (vISVs) (E′). At this time, Tg(flt4:YFP) is also expressed in lymphatic vessels (asterisk) (E′ and E′′). (F) Image of a Tg(Dll4in3:TagRFP) adult caudal fin (n = 6). Inset shows high-magnification image of the arteries in the fin rays displaying Dll4in3:TagRFP expression (yellow arrowheads). (G) Dorsal view of Tg(Dll4in3:TagRFP) ventricle at 15 hpi (n = 5). (H) Dorsal view of Tg(flt4:YFP) ventricle at 40 hpi (n = 5). (I) Lateral view of Tg(cxcr4a:YFP) ventricle at 4 dpi (n = 4). Inset shows cxcr4a:YFP+ sprouting coronaries. Dotted lines delineate the injured area. (Scale bars: A, B, and F, 100 µm; C, 300 µm; G-I, 50 µm.)