
|
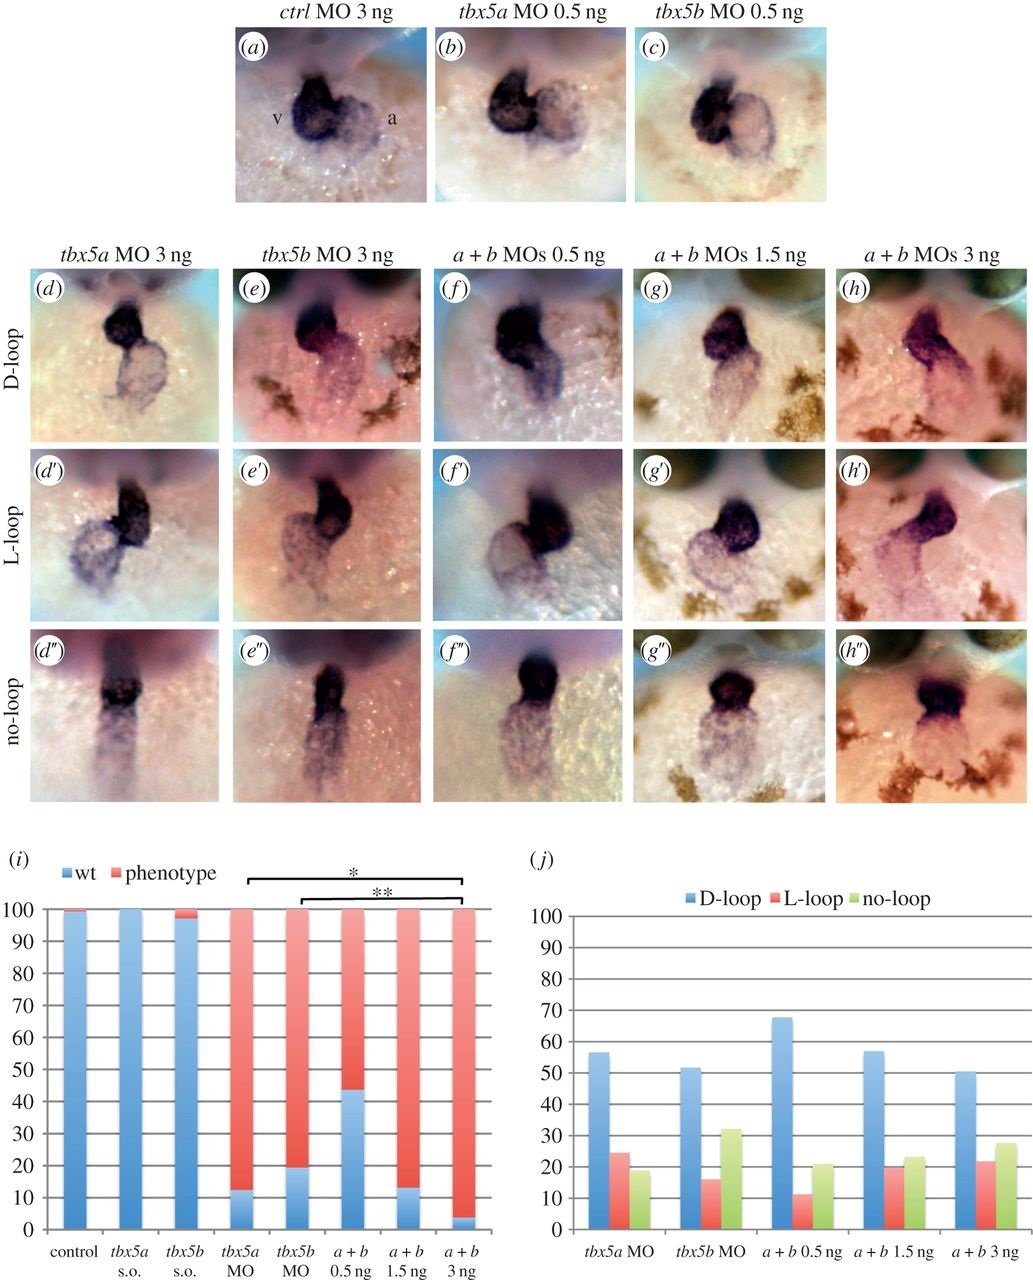
Fig. 1
Knock-down of tbx5 genes causes cardiac looping defects. (a-c) Embryos injected with control MO or sub-optimal concentrations of tbx5a or tbx5b MOs. (d-d′′) tbx5a morphant phenotypes. (e-e′) tbx5b-morphant phenotypes. (f-h′′) Double knock-down of tbx5 genes (0.5 ng each MO (f-f′′), 1.5 ng each MO (g-g′′) and 3 ng each MO (h-h′′)). (i) Quantification of the degree of looping phenotypes: wt, complete; phenotype, incomplete looping s.o., sub-otimal. (j) Quantification of the looping orientation phenotypes. A χ2 statistic has been calculated to assess significant differences between groups (**p < 0.001, *p < 0.05). Images are frontal views of 48 hpf embryos, and myl7 expression is used to highlight the developing heart.