
Image
|
Figure Caption
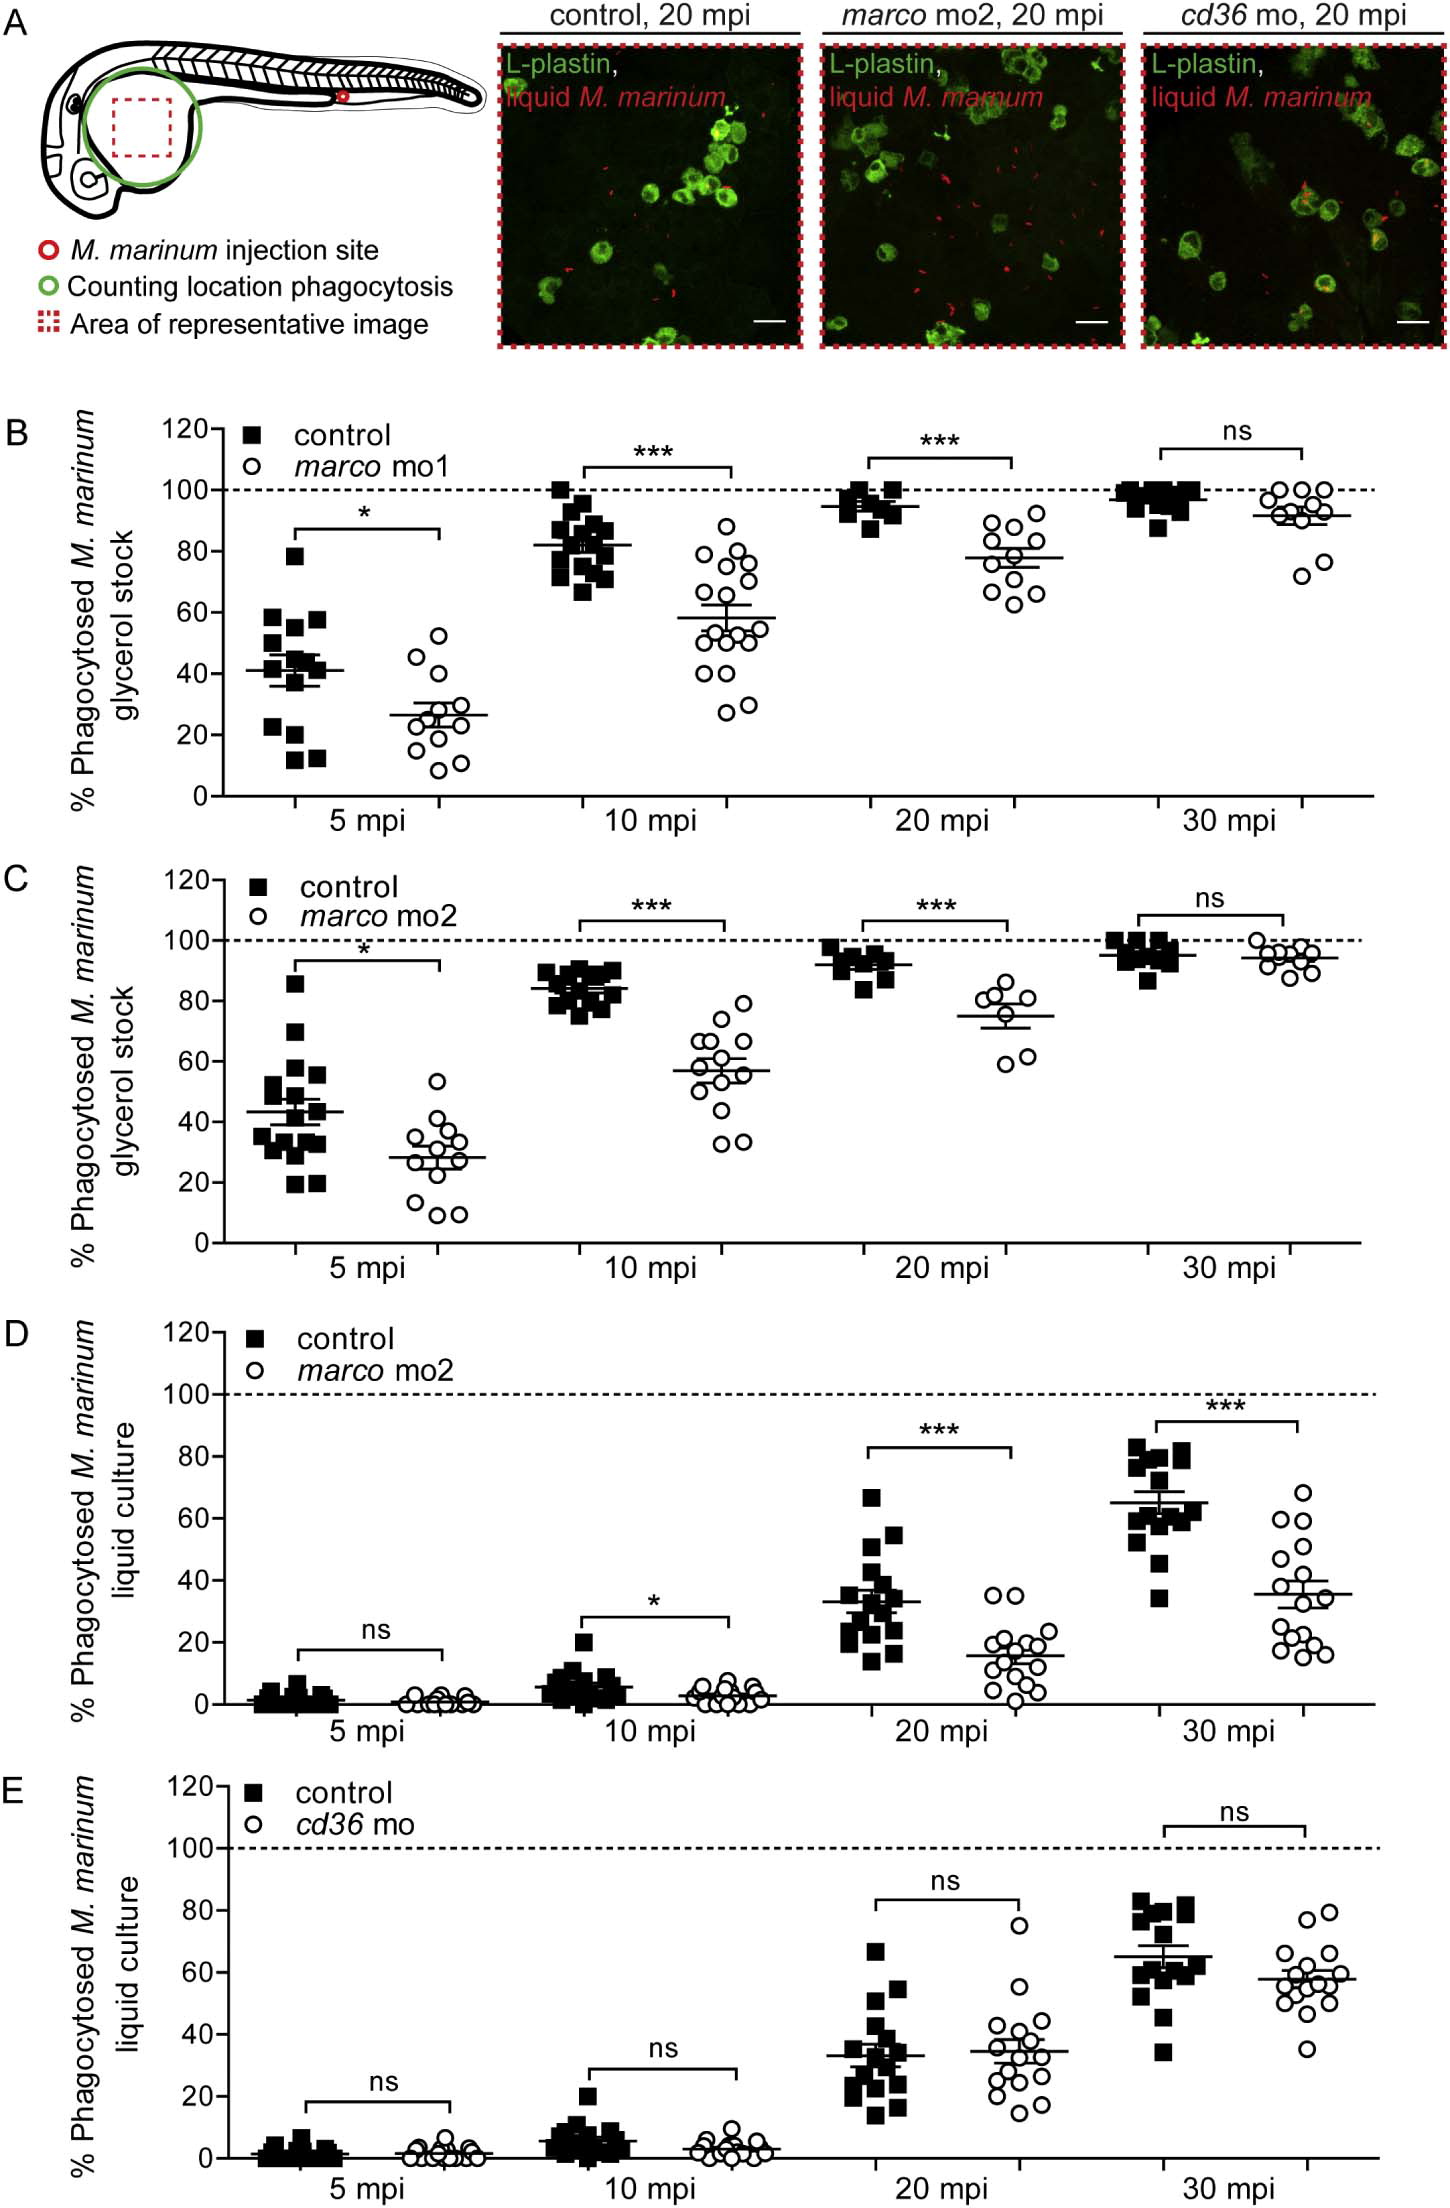
Fig. 2
Marco functions in the phagocytosis of M. marinum. Quantification of M. marinum phagocytosis. (A) Schematic overview of the phagocytosis quantification process and representative images of infected control embryos, marco morphants (mo2), and cd36 morphants at 20 mpi. (B–D) Morphants of marco ((B) morpholino 1 and (C,D) morpholino 2) show a delayed phagocytosis of M. marinum (B,C) glycerol stock and (D) 7H9 liquid culture. (E) Morphants of cd36 show no difference in phagocytosis of M. marinum. Each data point represents the percentage of phagocytosed M. marinum in an individual embryo.
Figure Data
Acknowledgments
This image is the copyrighted work of the attributed author or publisher, and
ZFIN has permission only to display this image to its users.
Additional permissions should be obtained from the applicable author or publisher of the image.
Full text @ Dev. Comp. Immunol.