
Image
|
Figure Caption
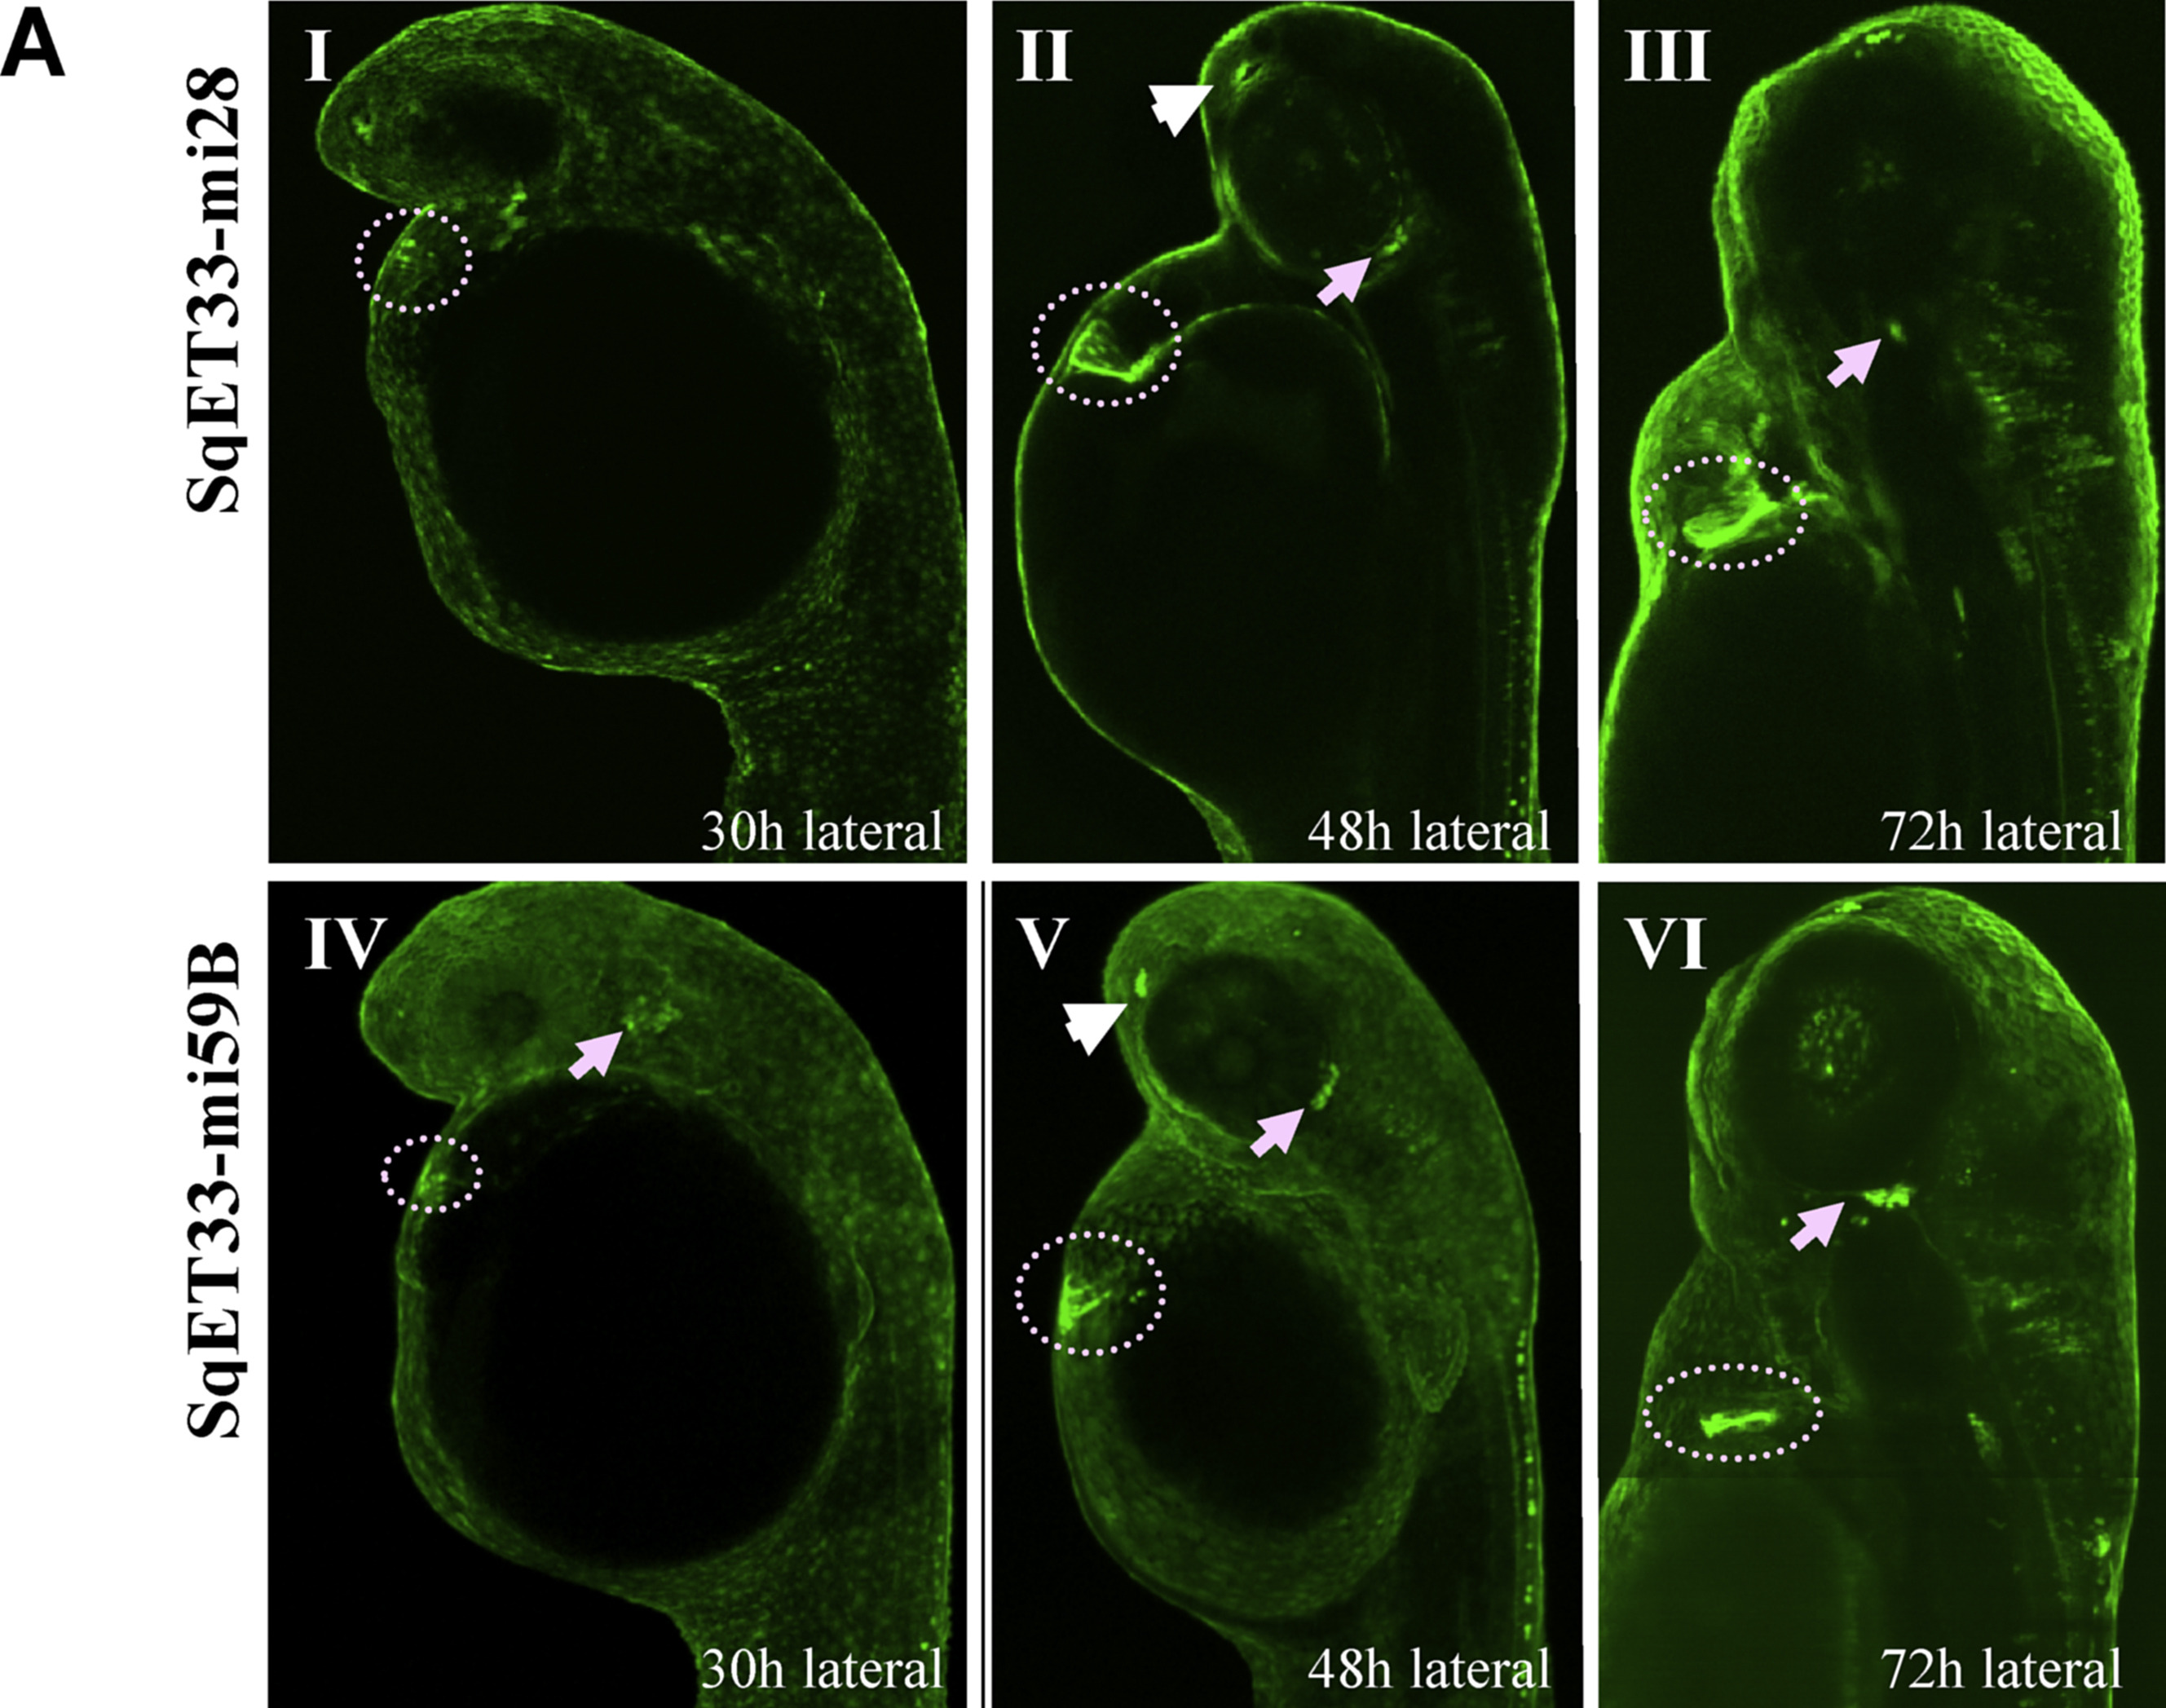
Fig. 1
The EGFP expression in CCS transgenics (low resolution analysis). A: Confocal Z-stack images of both SqET33-mi28 and SqET33-mi59B in vivo at 30 hpf (I,IV), 48 hpf (II,V) and 72 hpf (III,VI), lateral view. The fluorescence expression in the heart is indicated with a doted circle whereas the cranial ganglia are marked with an arrow and olfactory pit with an arrowhead.
Figure Data
Acknowledgments
This image is the copyrighted work of the attributed author or publisher, and
ZFIN has permission only to display this image to its users.
Additional permissions should be obtained from the applicable author or publisher of the image.
Reprinted from Gene expression patterns : GEP, 21(2), Poon, K.L., Liebling, M., Kondrychyn, I., Brand, T., Korzh, V., Development of the cardiac conduction system in zebrafish, 89-96, Copyright (2016) with permission from Elsevier. Full text @ Gene Expr. Patterns