
Image
|
Figure Caption
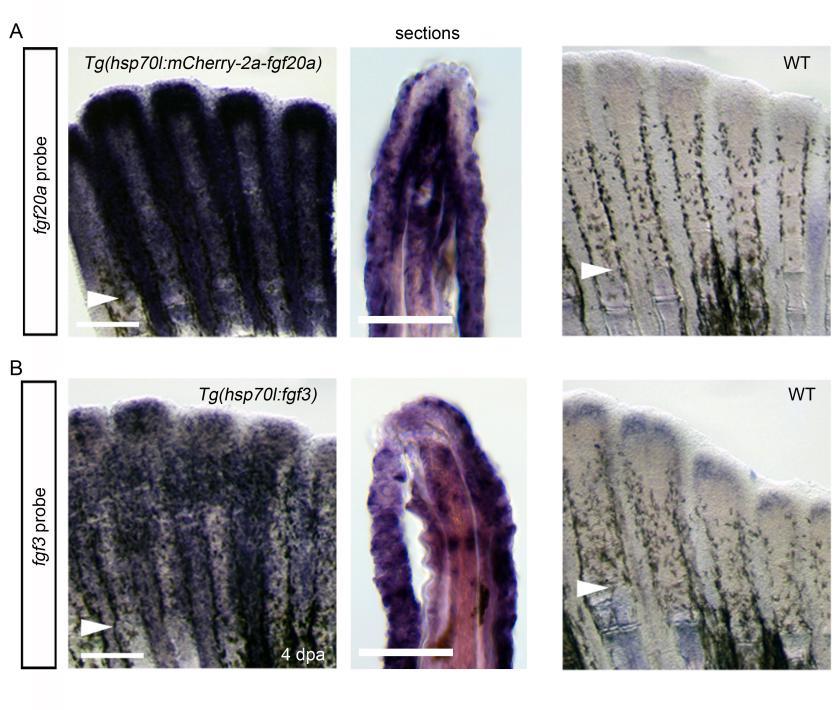
Fig. S11
Levels of fgf20a and fgf3 expression in Tg fins overexpressing fgf20a and fgf3, respectively. (A) ISH analysis of fgf20a expression in Tg fins overexpressing fgf20a and wild-type (WT) at 4 dpa. (B) ISH analysis of fgf3 expression in the Tg fins overexpressing fgf3 and WT fins at 4 dpa. All ISH analyses were performed simultaneously under the same conditions including the duration of the colour reaction. n > 5 fins, respectively. Scale bars, 200 µm for the whole mount analysis and 50 µm for the tissue sections. Arrowheads, the site of amputation.
Acknowledgments
This image is the copyrighted work of the attributed author or publisher, and
ZFIN has permission only to display this image to its users.
Additional permissions should be obtained from the applicable author or publisher of the image.
Full text @ Development