
|
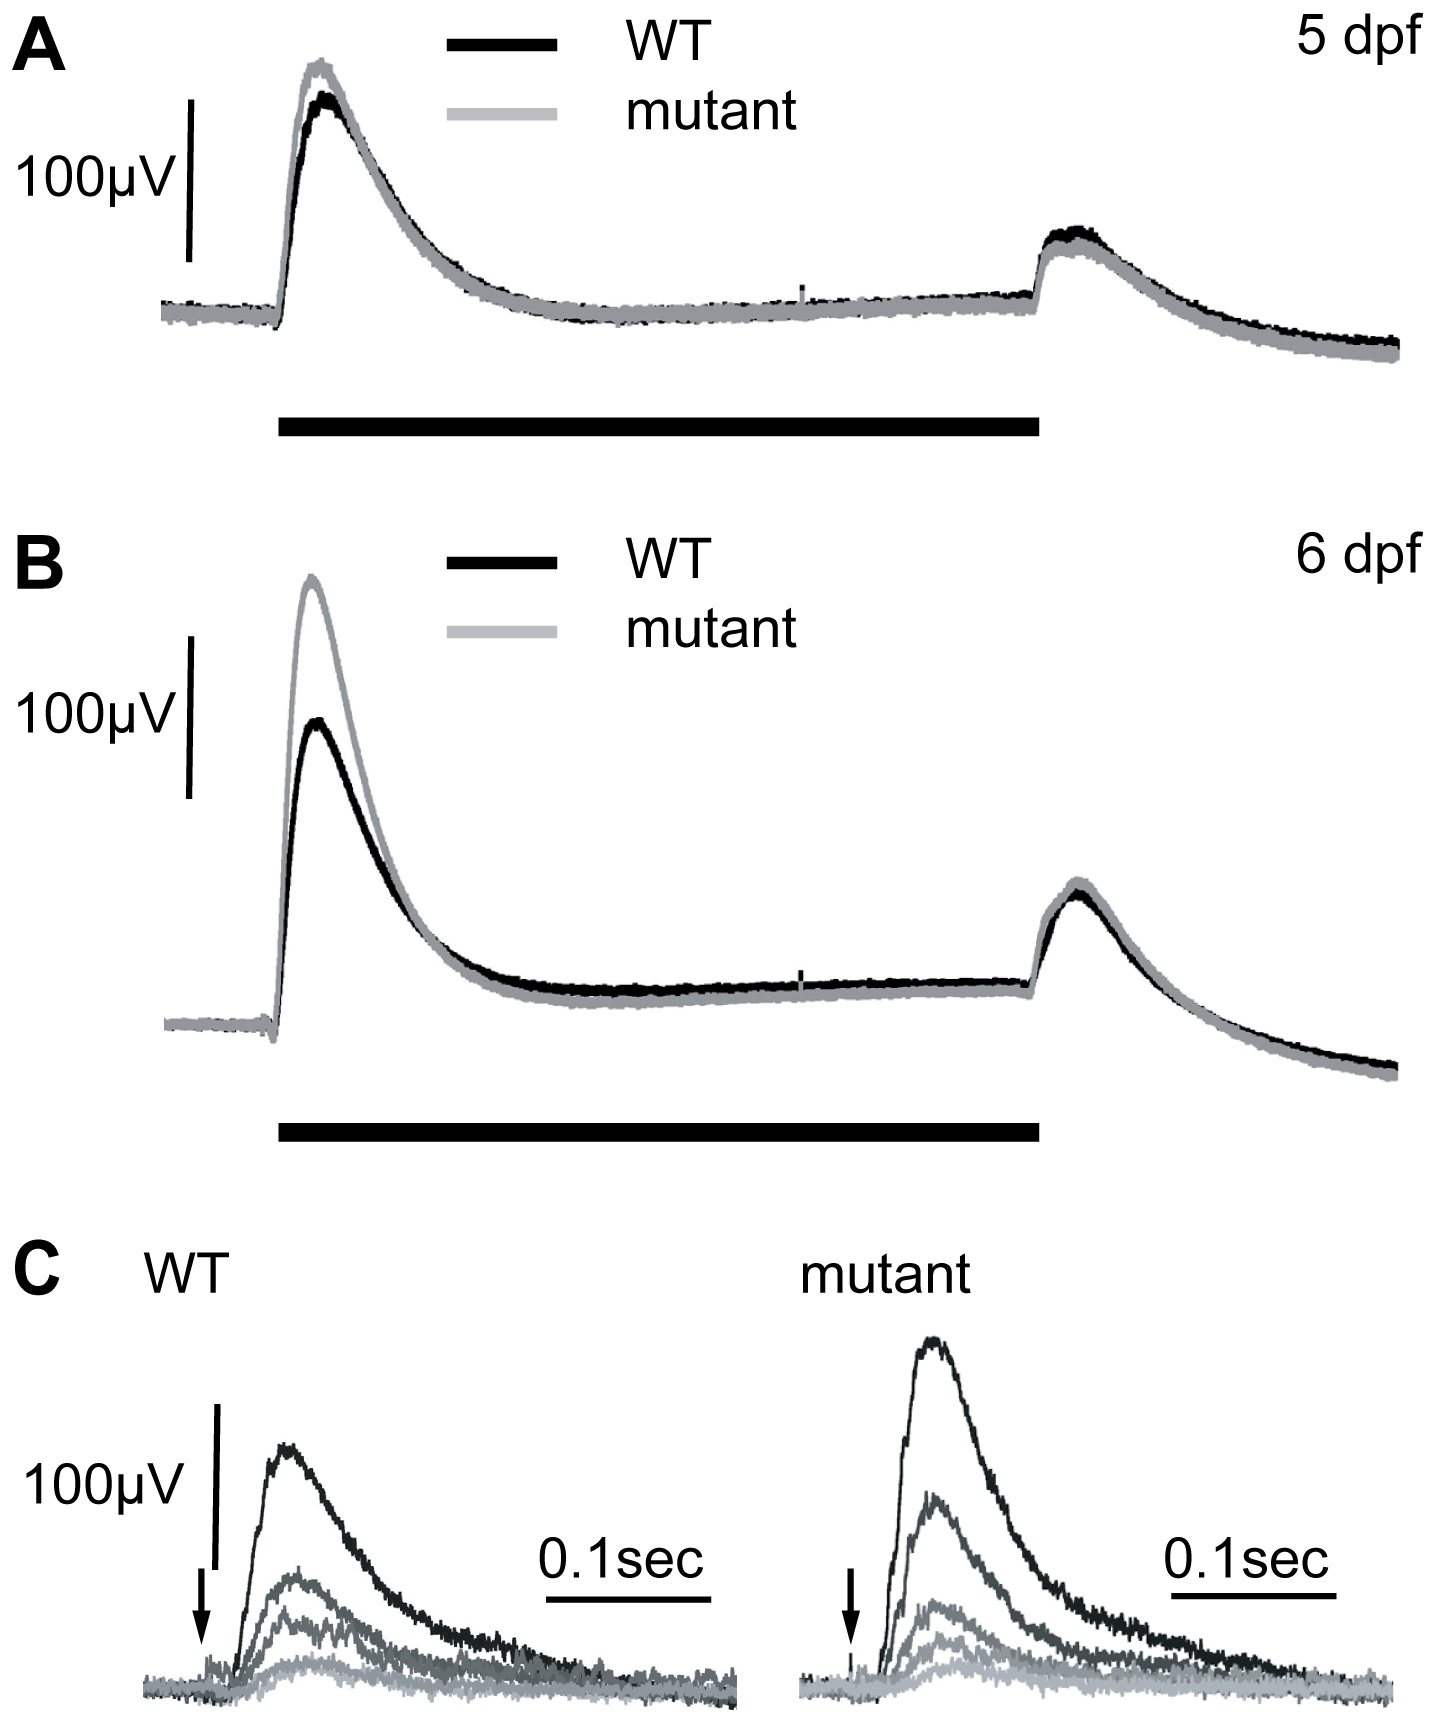
Fig. 2
Electroretinograms show an increase in the b-wave response in mutants at 6 dpf.
A) At 5 dpf, WT and zvm7w65 responses are similar. B) At 6 dpf, zvm7w65 eyes develop an increase in the b-wave. The b-wave was 176±13 µV in the WT (n = 30) and 260±48 µV in the zvm7w65 fish at 6 dpf (n = 32) (p<.001). A) and B) show an average representative trace including at least 9 animals. C) WT and zvm7w65 eyes have a similar light threshold response. Eyes were exposed to a millisecond light flash (arrow) at intensities differing by 0.5 log units (brightest = .41 mW). Amplitudes of mutant b-waves were larger at all light levels. Images show traces from a single representative animal.