
|
Fig. S1
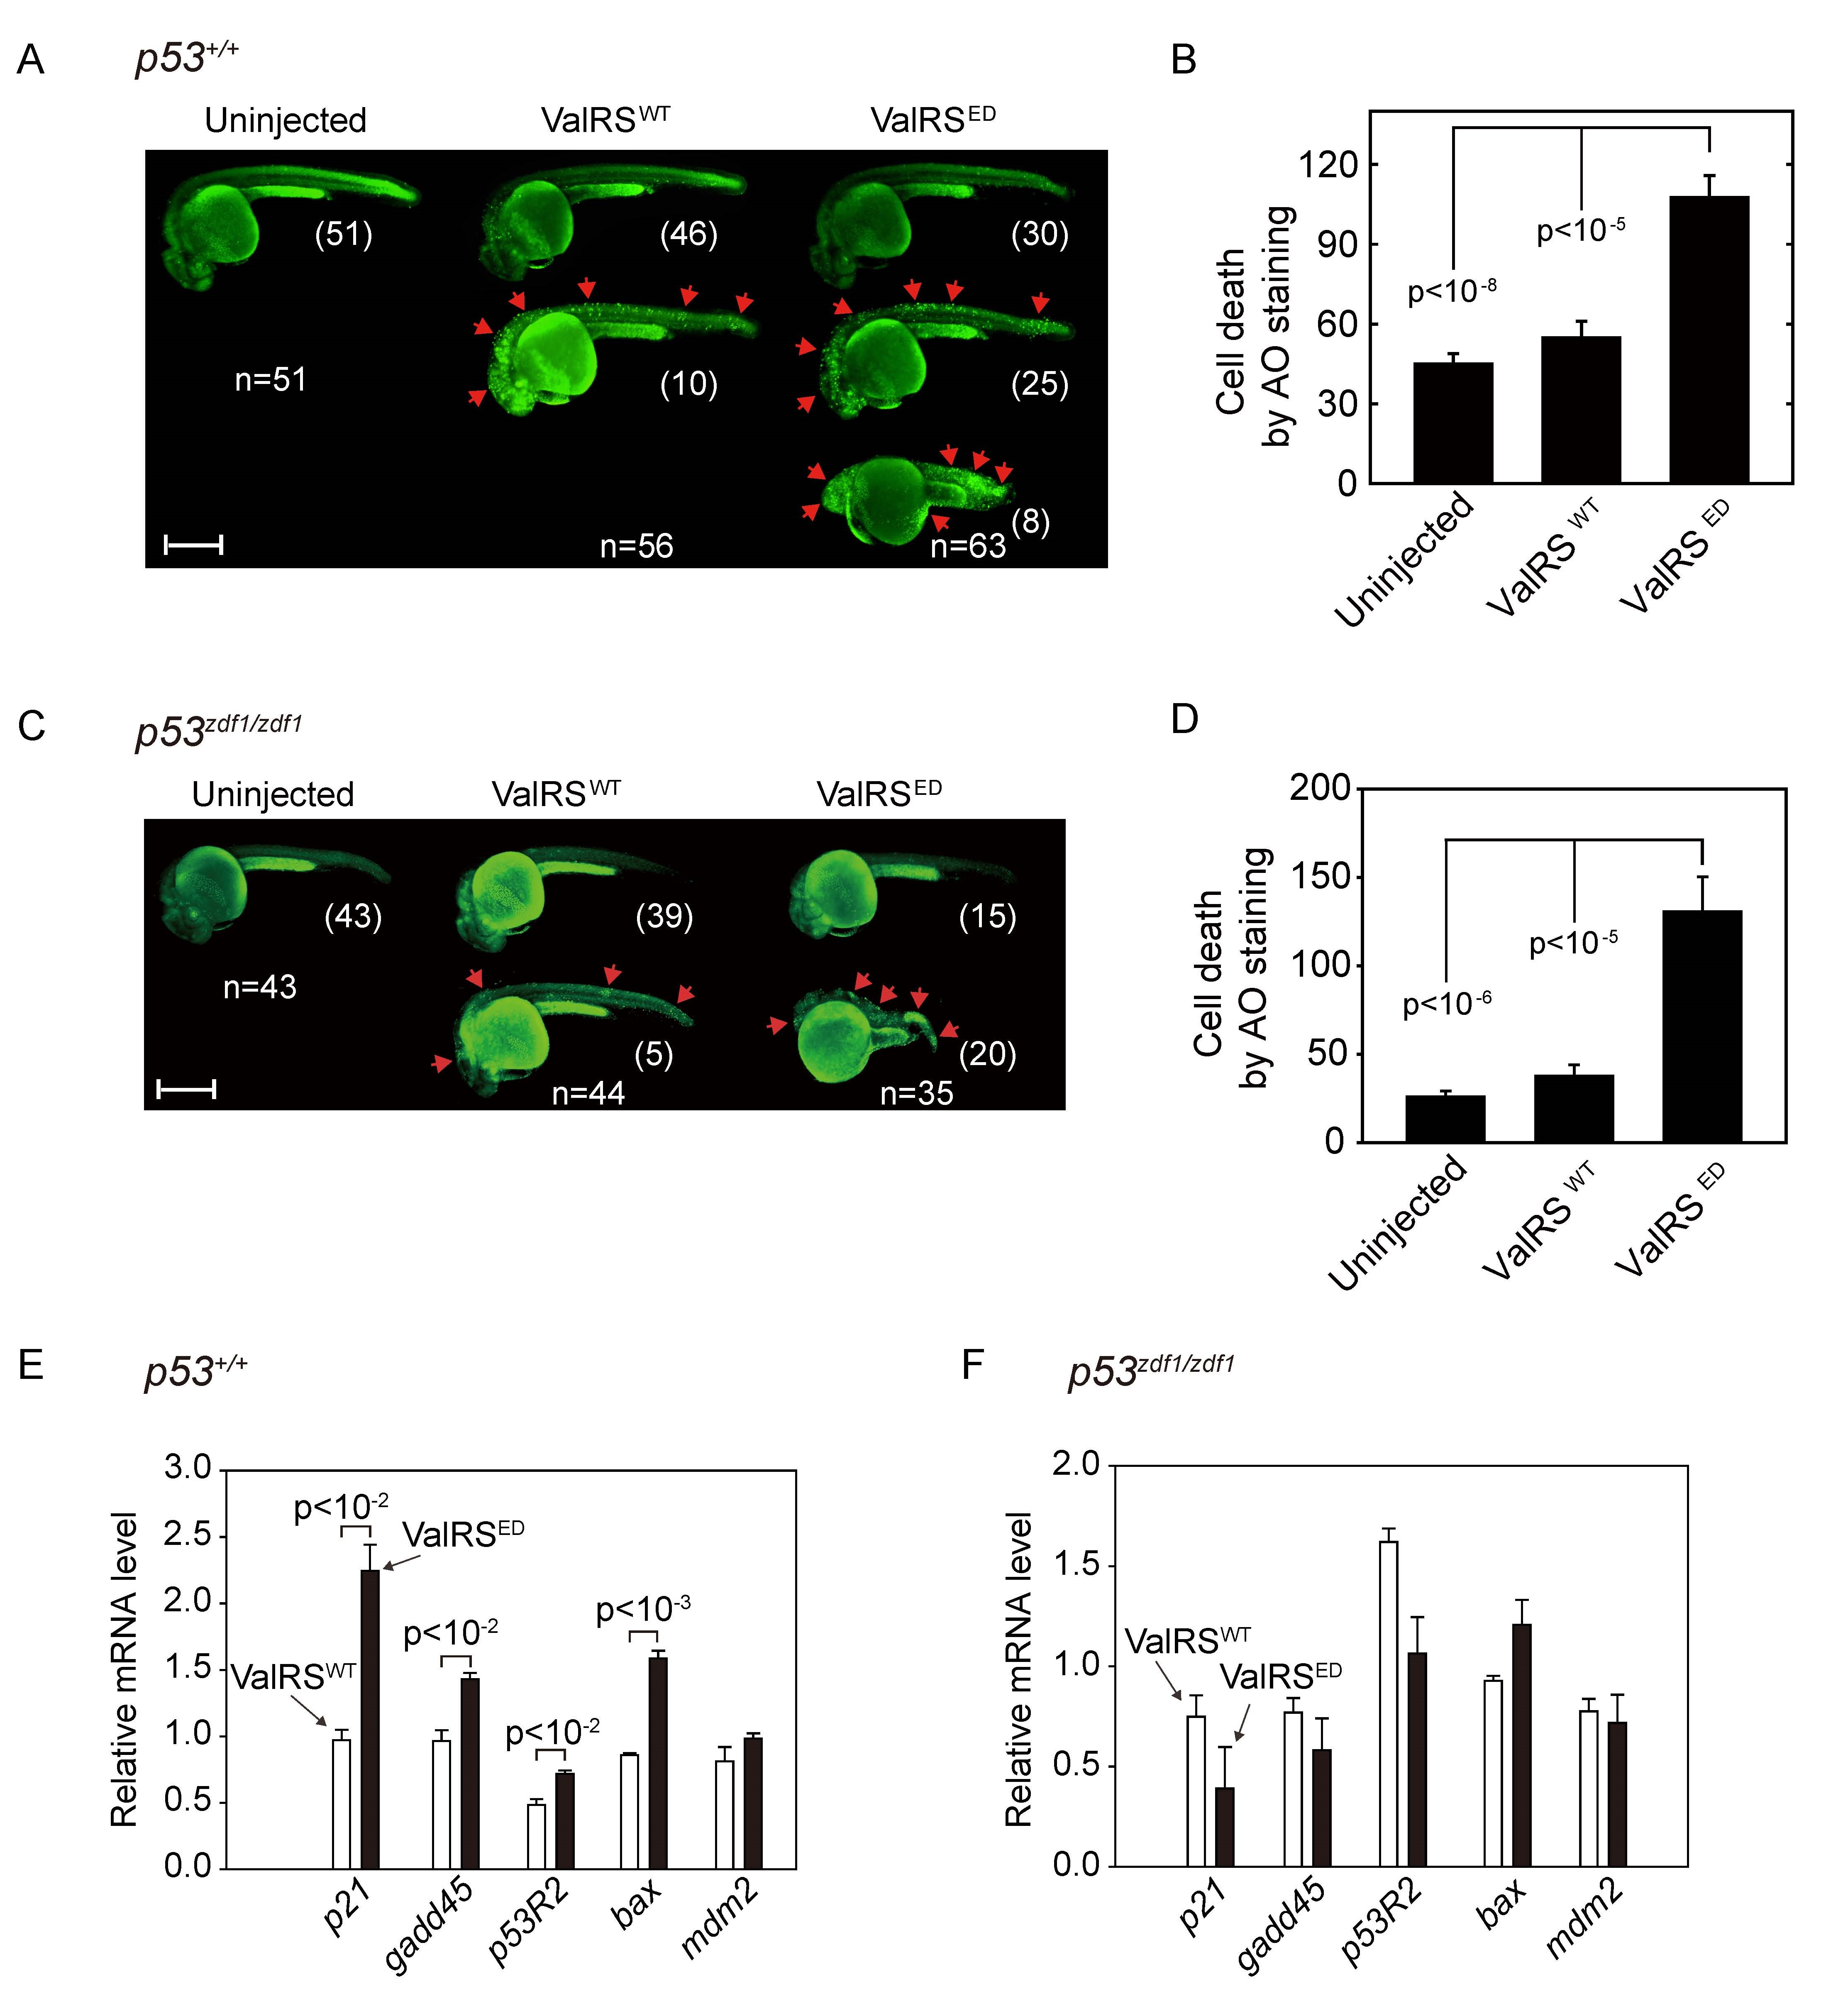
mValRSED mRNA injection into zebrafish results in cell death and p53 activation. A) Acridine orange (AO) staining at 1 dpf of zebrafish uninjected (n=51), or injected with either mValRSWT mRNA (n=56) or mValRSED mRNA (n=63). The red arrows show points of cell death. Zebrafish are aligned vertically based on cell death severity and morphology; normal (top), increased cell death (middle), and increased cell death with abnormal morphology (bottom). Scale bar represents 500 µm. B) Quantification of acridine orange staining per fish. Bars represent mean ± SEM. C) Uninjected (n=43), mValRSWT mRNA injected (n=44), or mValRSED mRNA injected (n=35) p53zdf1/zdf1 zebrafish were stained with acridine orange at 1 dpf. The red arrows show points of cell death. Zebrafish are aligned based on cell death severity. Scale bar represents 500 µm. D) Quantification of acridine orange staining. Bars represent mean ± SEM. RT-PCR results of p53 downstream markers p21, gadd45, p53R2, bax and mdm2 in E) p53+/+ or F) p53zdf1/zdf1 zebrafish injected with either mValRSWT or mValRSED mRNA.