
|
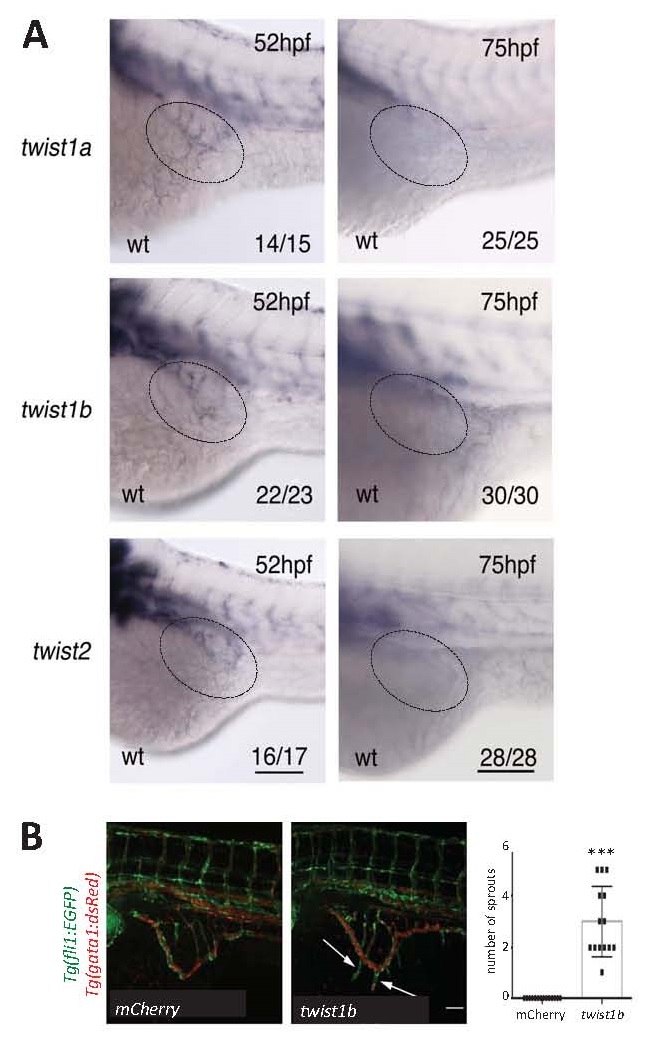
Fig. S6
twist1 regulated sub-intestinal vein sprouting in embryos. (A) In situ hybridisation analysis of twist1a, twist1b or twist2 expression in embryos at 52 or 75 hpf. Scale bar, 100 µm. SIV region is indicated using a broken line. Data shown are representative of the majority of embryos analysed (proportion indicated lower right in each panel). (B) Embryos (Tg(fli1:EGFP;gata1:dsRed)) were treated with twist1b mRNA (to enforce expression) or with mCherry mRNA as a control. They were studied at 75 hpf (flow was established as evidenced by gata1-positive red blood cells). Confocal microscopy was used to visualise angiogenic sprouts (arrows). The number of angiogenic sprouts was quantified for multiple embryos and mean values +/- SEM are shown. Representative images are shown. Scale bar, 500 µm. *** p<0.001 using an unpaired t-test.