
|
Fig. S2
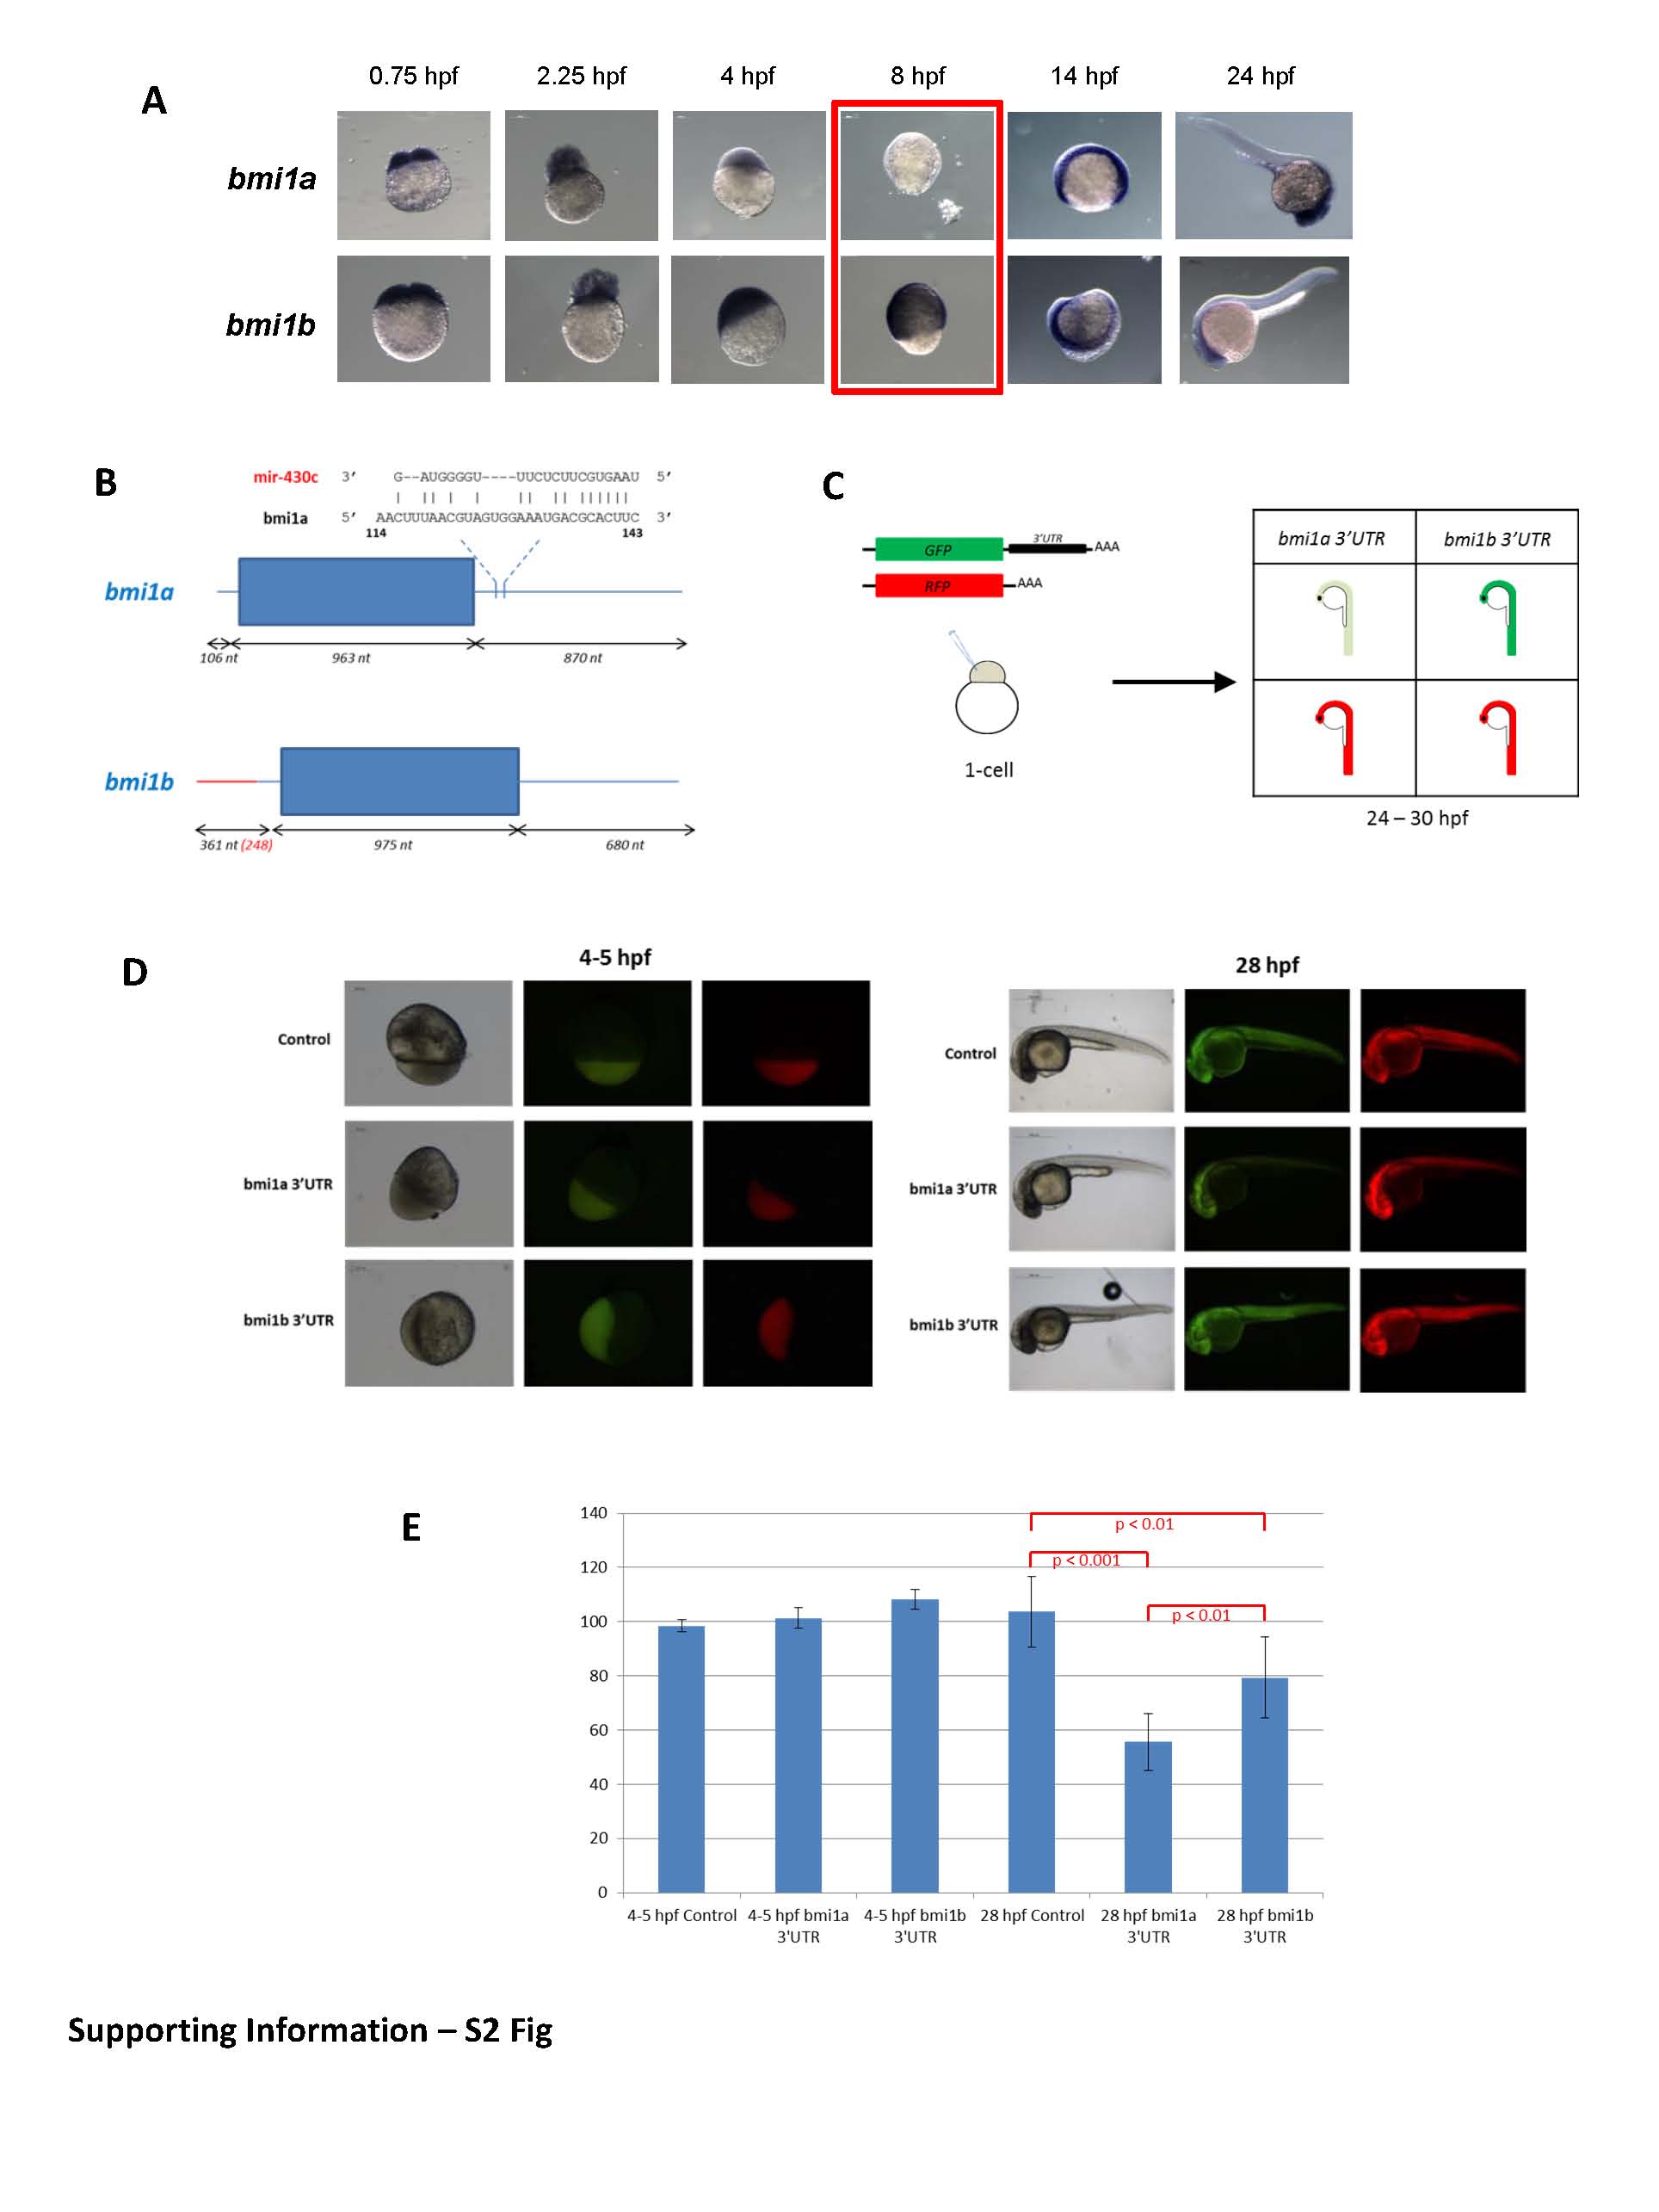
The bmi1a 3′UTR reduces GFP expression levels in zebrafish embryos.
(A) Comparison of bmi1a and bmi1b expression levels during zebrafish development analyzed by whole-mount in situ hybridization. Note that bmi1a transcripts are not detected at 8 hpf while bmi1b transcripts are present. (B) Organization of the bmi1a and bmi1b transcripts. A predicted base pairing between miR-430c and the bmi1a 3′UTR is shown. (C) Experimental set-up to test the effect of the bmi1a 3′UTR on GFP expression levels. A GFP reporter mRNA containing no 3′UTR (control), the bmi1a 3′UTR or the bmi1b 3′UTR is co-injected with control dsRed (RFP) mRNA into 1-cell stage embryos. (D) GFP reporter expression (green) and control dsRed expression (red) at 4-5 hpf monitor mRNA injection (left panels). GFP reporter expression and control dsRed expression at 28 hpf reveals that bmi1a 3′UTR reduces GFP expression levels (right panels). (E) Quantification of relative GFP expression levels. Error bars indicate ± SD; n > 15 embryos per experiment; Statistical significance was assessed by Student t-test analysis and significance expressed as the indicated p values.