
|
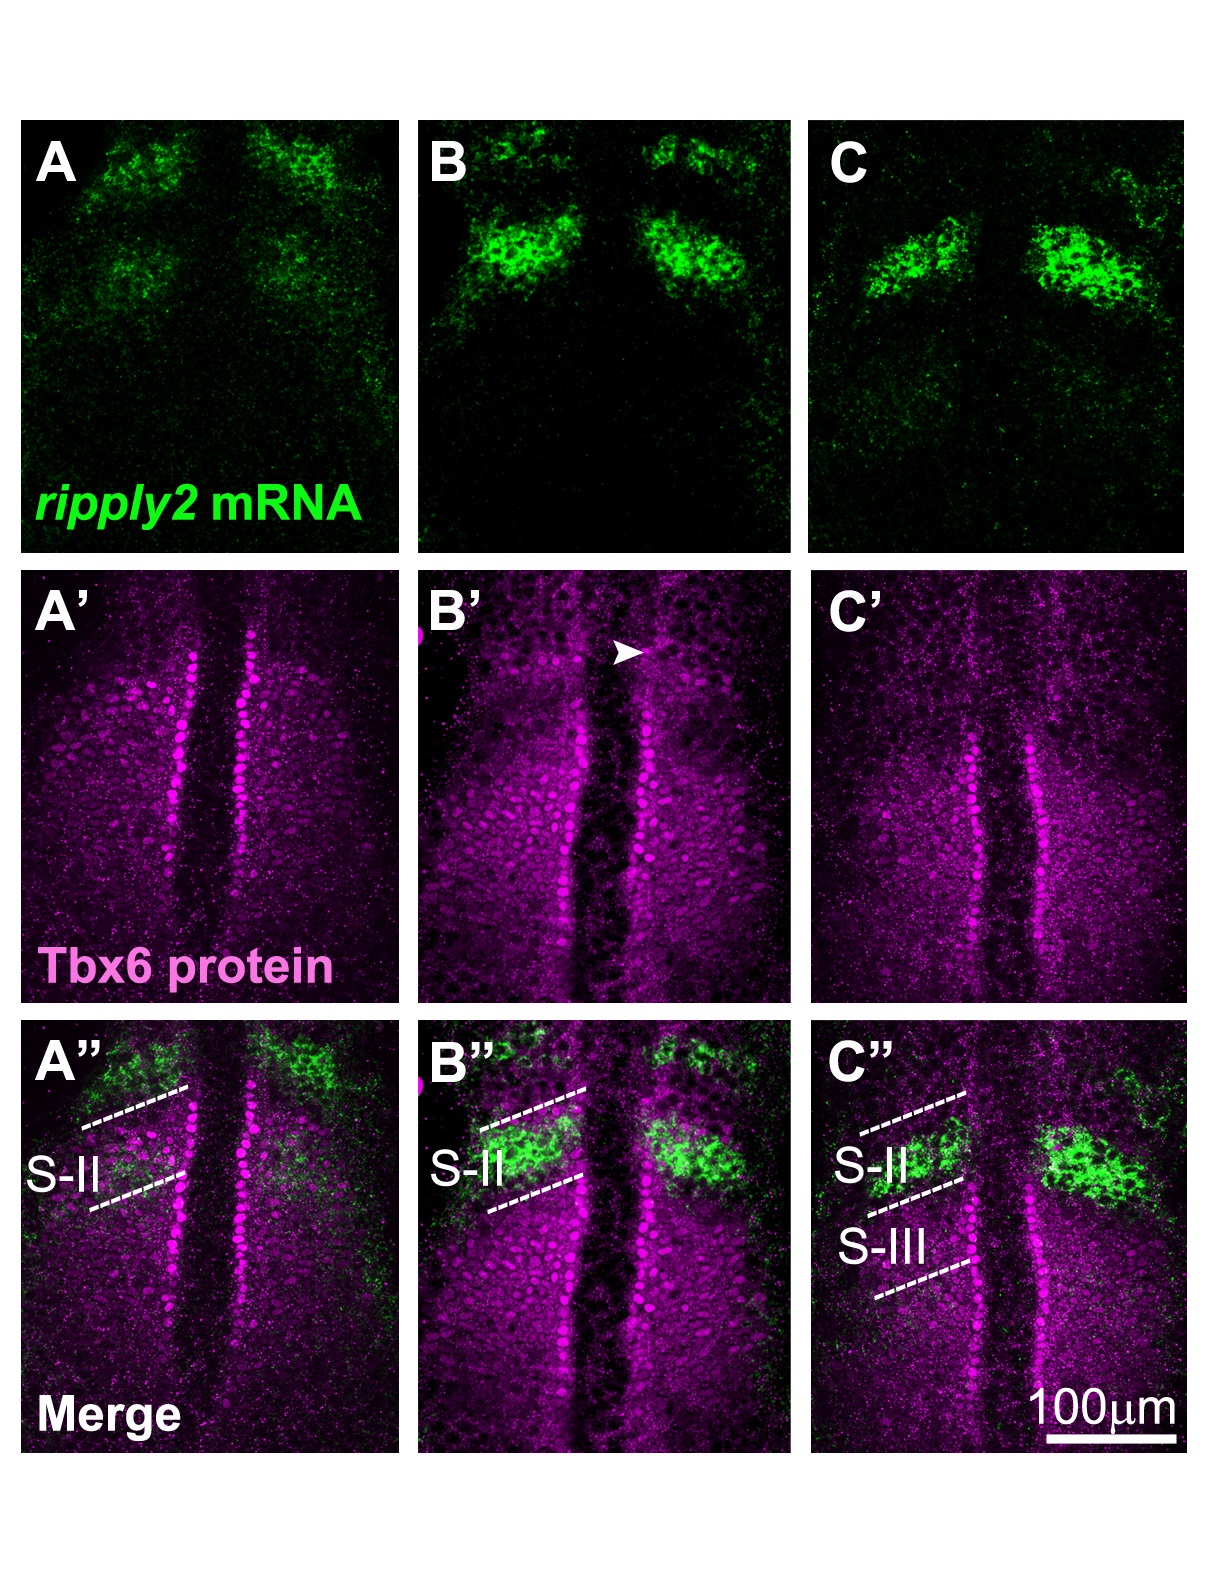
Fig. S3
Expression of zebrafish ripply2 and Tbx6 protein. (A-A′′) The expression of ripply2 mRNA was initiated at the anterior region of the Tbx6 domain when the core domain was longer (B-B′′). Accordingly to the increase in ripply2 expression, Tbx6 proteins were eliminated in ripply2 positive area, resulting in gap between the upper band and the core domain of the Tbx6 expression. (C-C′′) Finally, when the Tbx6 anterior region was completely eliminated, ripply2 was strongly expressed in S-II region. The S-II and S-III regions are marked by dotted lines. The phases shown in A, B and C are consistent with those in Fig.3. White arrowhead indicates the upper band of Tbx6 protein.