
|
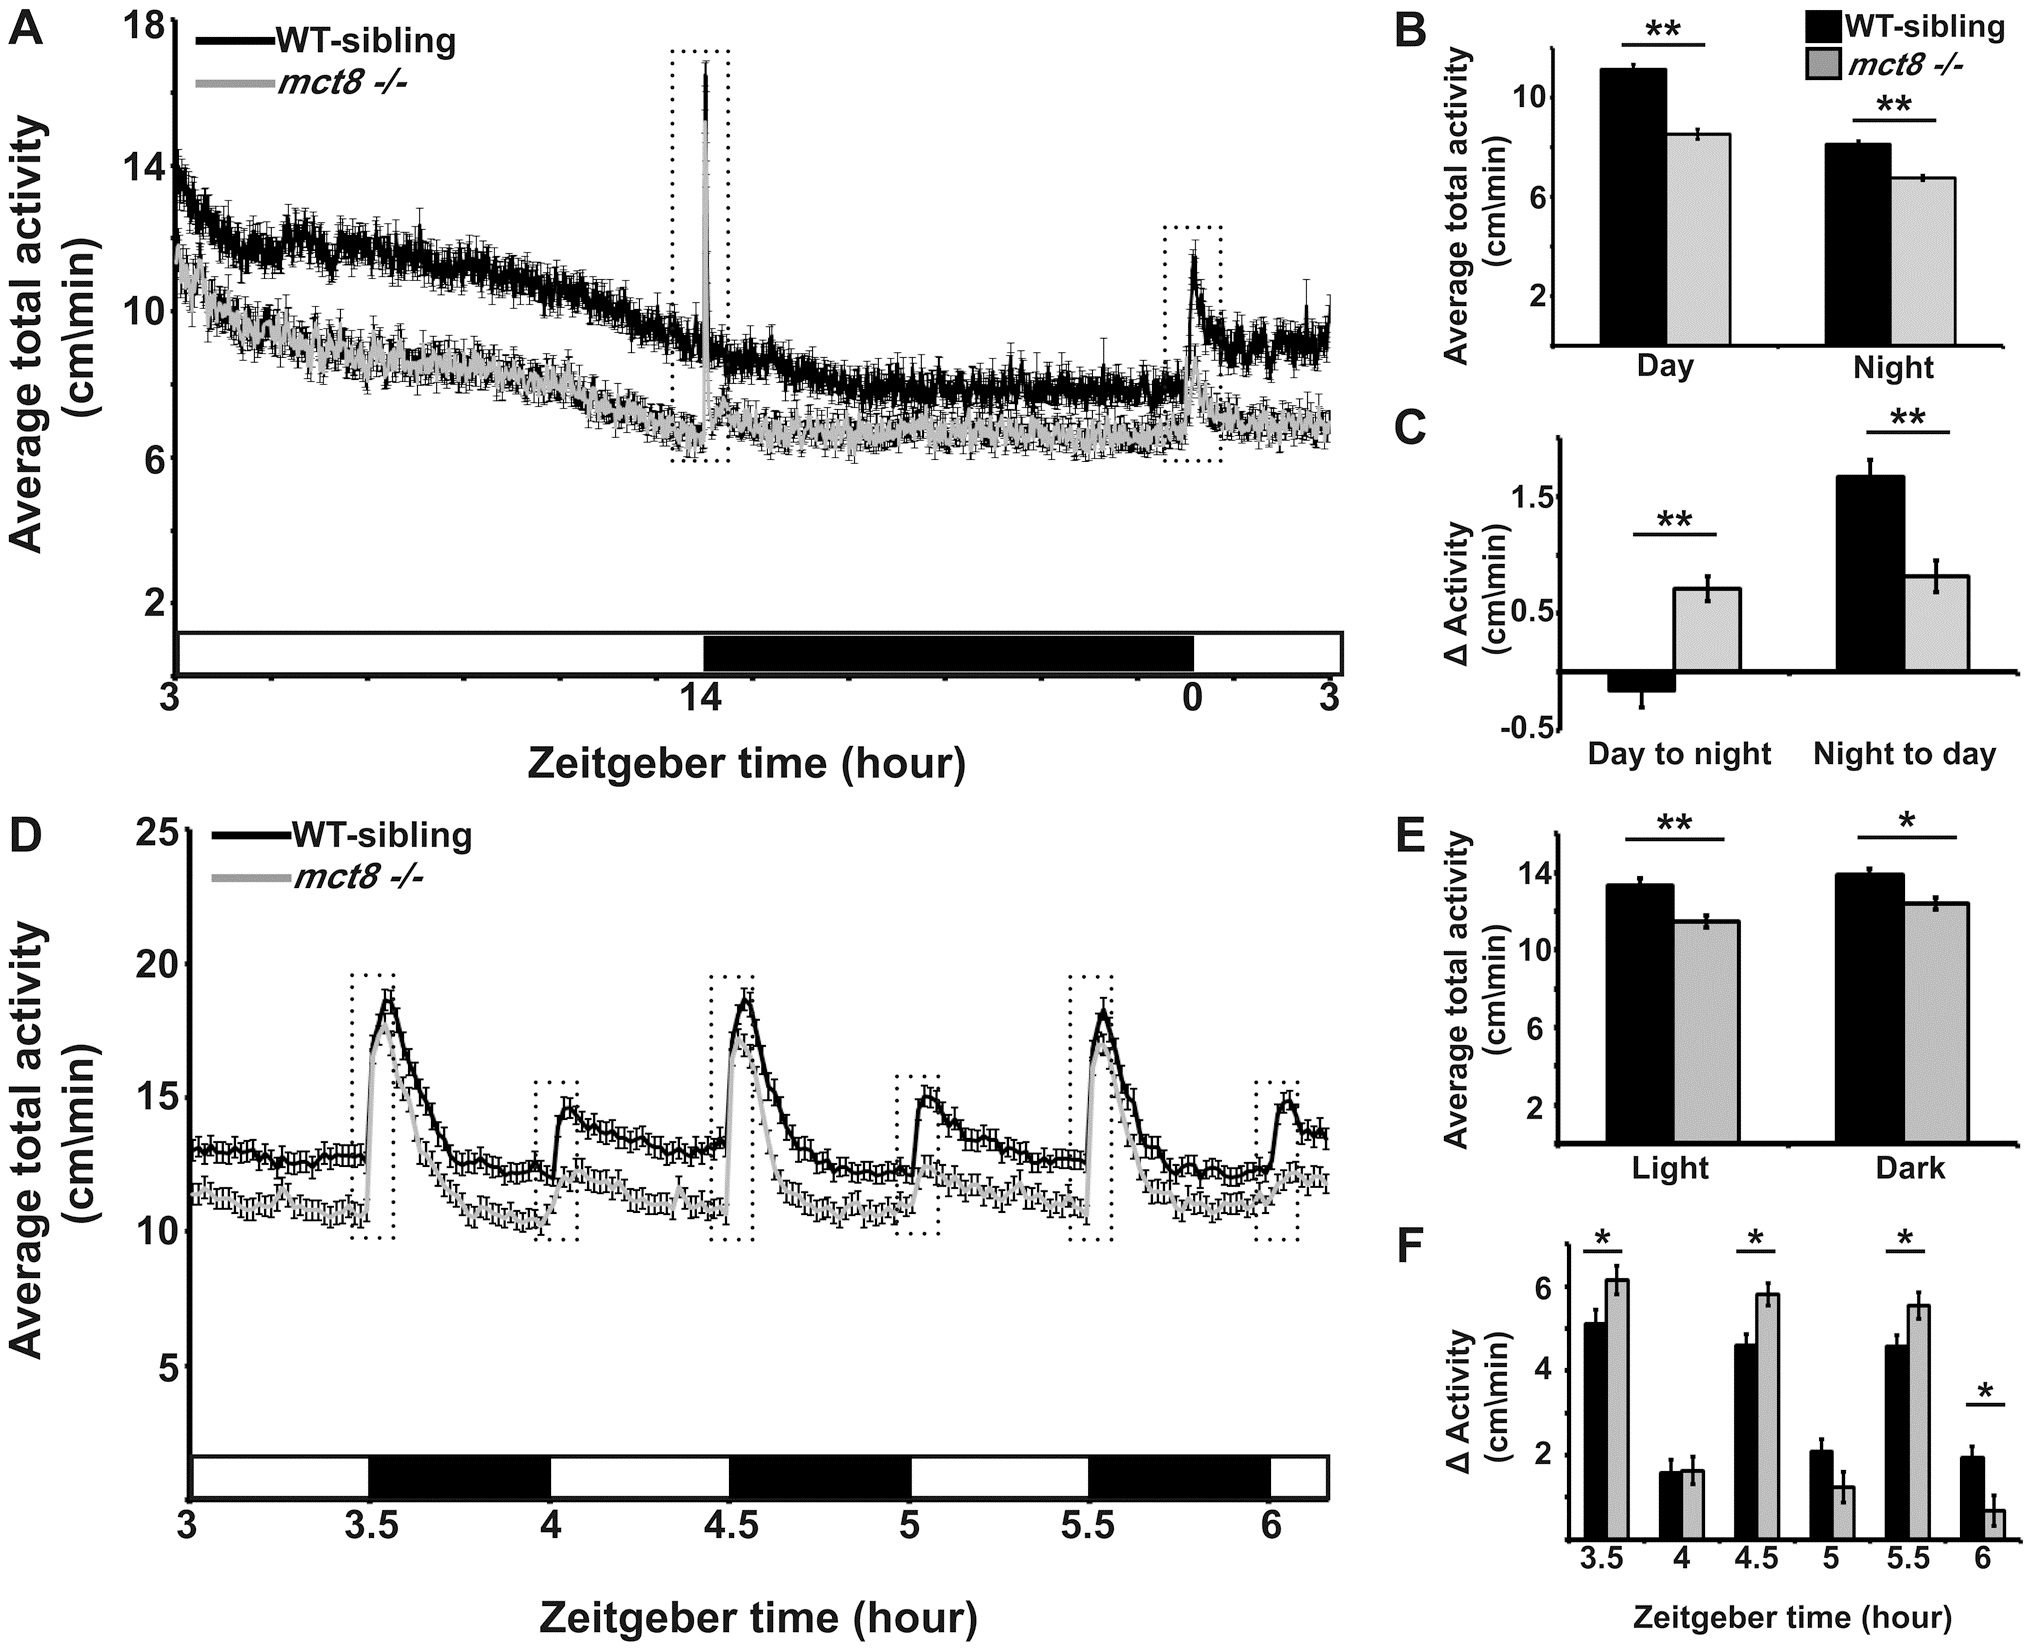
Fig. 4
MCT8 mutant exhibits reduced locomotor activity and altered responses to light/dark transitions. Locomotor activity recording was performed in 6 dpf mct8-/- larvae and their WT siblings throughout a daily cycle under a 14 h light/10 h dark cycle (A-C), or during 3 h of 30 min light/30 min dark intervals (D-F). White and black horizontal boxes represent light and dark periods, respectively. Average total activity of each genotype was measured as the average distance movement in 1 min (A and D). Dotted boxes represent 1 h and 5 min (in A and D, respectively) before and after the light-to-dark and dark-to-light transitions. The average total activity of each genotype was measured during day and night as well as during short light and dark periods (B and E, respectively). Differences in the average total activity of each genotype were calculated by comparing 1 h after and 1 h before the day-to-night and night-to-day transitions, as well as by comparing 5 min after and 5 min before light-to-dark and dark-to-light transitions (C and F, respectively). Values are represented as means±SEM (standard error of the mean). Statistical significance determined by t-test: two-sample assuming unequal variances (*p<0.05, ** p<0.001).