
|
Fig. 3
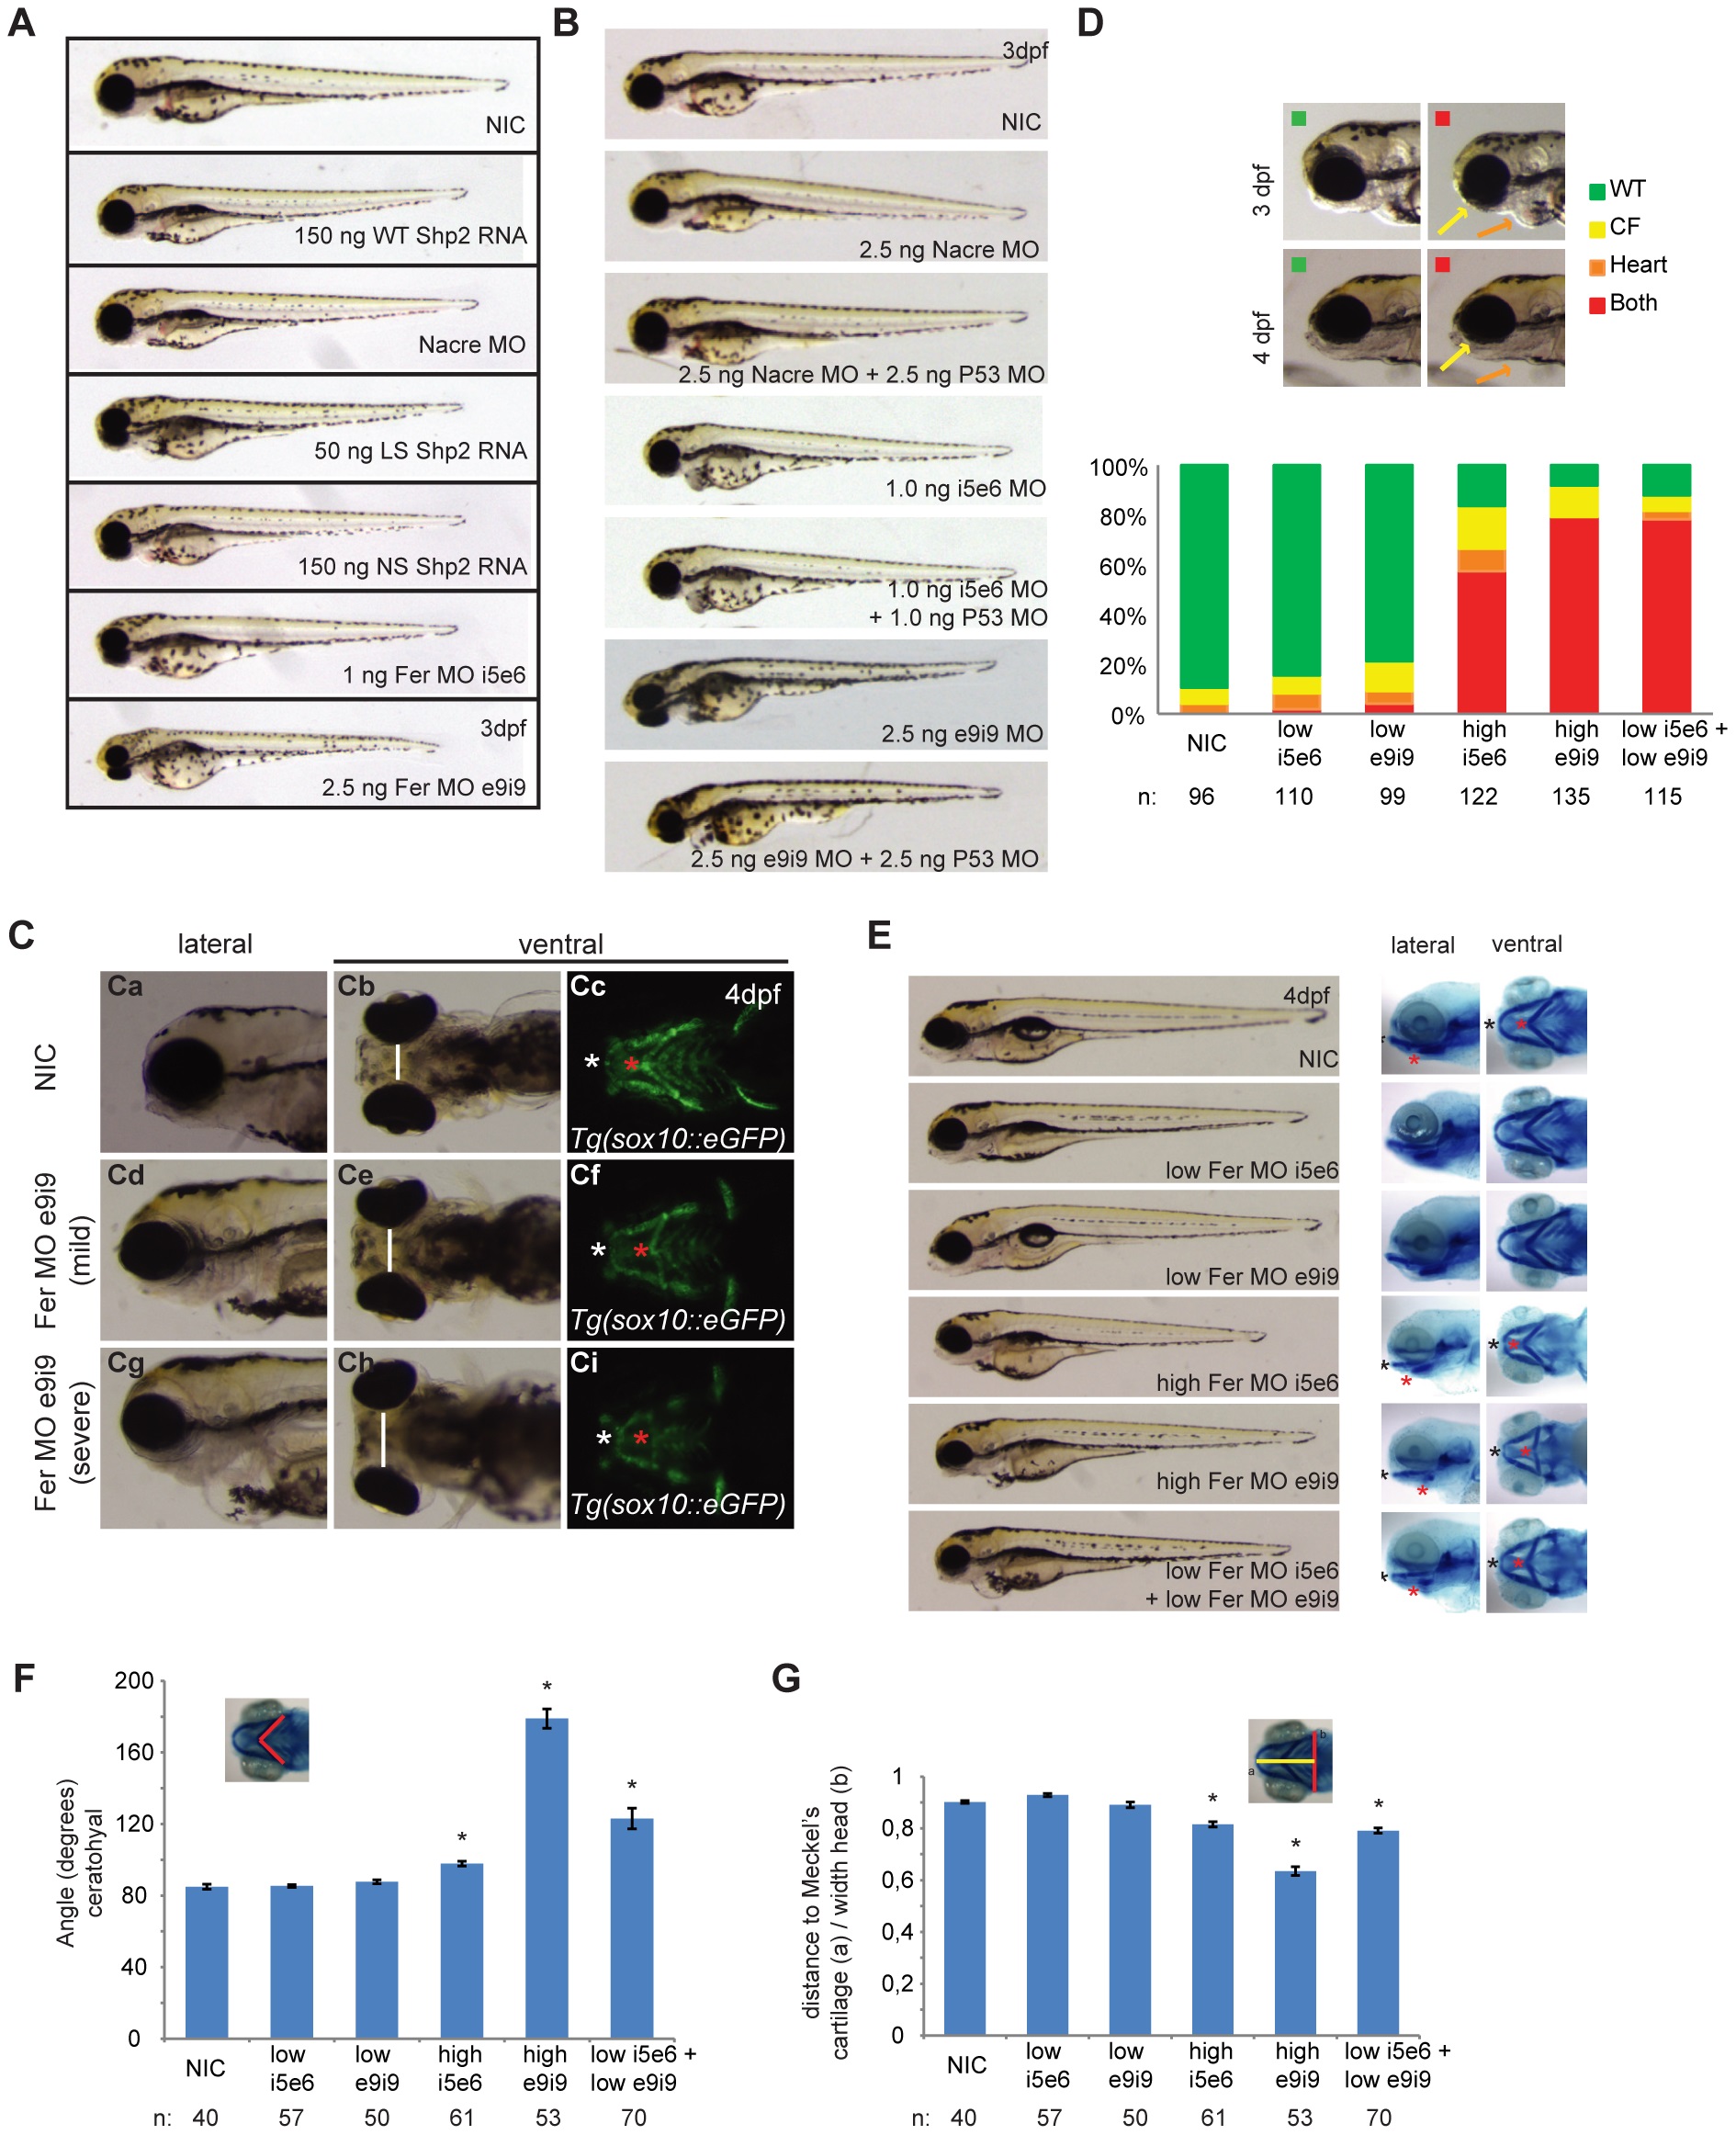
Fer knockdown induced craniofacial defects in zebrafish embryos.A. Embryos were injected at the 1-cell stage with 1 ng Fer i5e6 MO, 2.5 ng e9i9 MO or 2.5 ng Nacre MO as a negative control. Additionally, embryos were injected with 150 ng WT Shp2 RNA, 150 ng NS Shp2 RNA or 50 ng LS Shp2 RNA. B. Embryos were injected at the 1-cell stage with 2.5 ng Nacre control MO, 1.0 ng Fer i5e6 MO, 2.5 ng Fer e9i9 MO or in combination with 2.5 ng P53 MO. C. Craniofacial structures were imaged using Tg(-4.9sox10:EGFP)ba2 embryos expressing eGFP in neural crest cells that also form the cartilage. Embryos were injected with Fer MO e9i9 at the 1 cell stage and imaged at 4dpf. Ceratohyal is indicated with a red asterisk and Meckel′s cartilage with a white asterisk. Both moderate and severe phenotypes are depicted together with non-injected controls (NIC). D. Embryos were injected at the 1-cell stage with suboptimal concentrations of MO (0.5 ng i5e6 MO; n = 110 and 1.0 ng e9i9 MO; n = 99). High levels of both MO′s (1.0 ng i5e6 MO; n = 122 and 2.5 e9i9 MO; n = 135) or low levels of both MO′s were co-injected (n = 115). Embryos were imaged at 3 dpf and 4 dpf and grouped by having a WT appearance (green), a craniofacial defect alone (yellow) a heart defect alone (orange) or both (red) at 4 dpf. Relative levels of phenotypes are depicted. E. Embryos were injected at the 1-cell stage with normal dose of MO (1.0 ng i5e6 MO; n = 61 and 2.5 e9i9 MO; n = 53), low doses of MO (0.5 ng i5e6 MO; n = 57 and 1.0 ng e9i9 MO; n = 50) or a co-injected with low doses of MO (n = 70). Morphology at 4 dpf is depicted. Embryos were fixed and stained with Alcian blue at 4 dpf and imaged laterally and ventrally. For quantification, the angle of the ceratohyal (F) and the ratio of the distance from the back of the head to Meckel′s cartilage and the width of the head was determined (G) (* indicates significance, Student′s t-test p<0.005).