
|
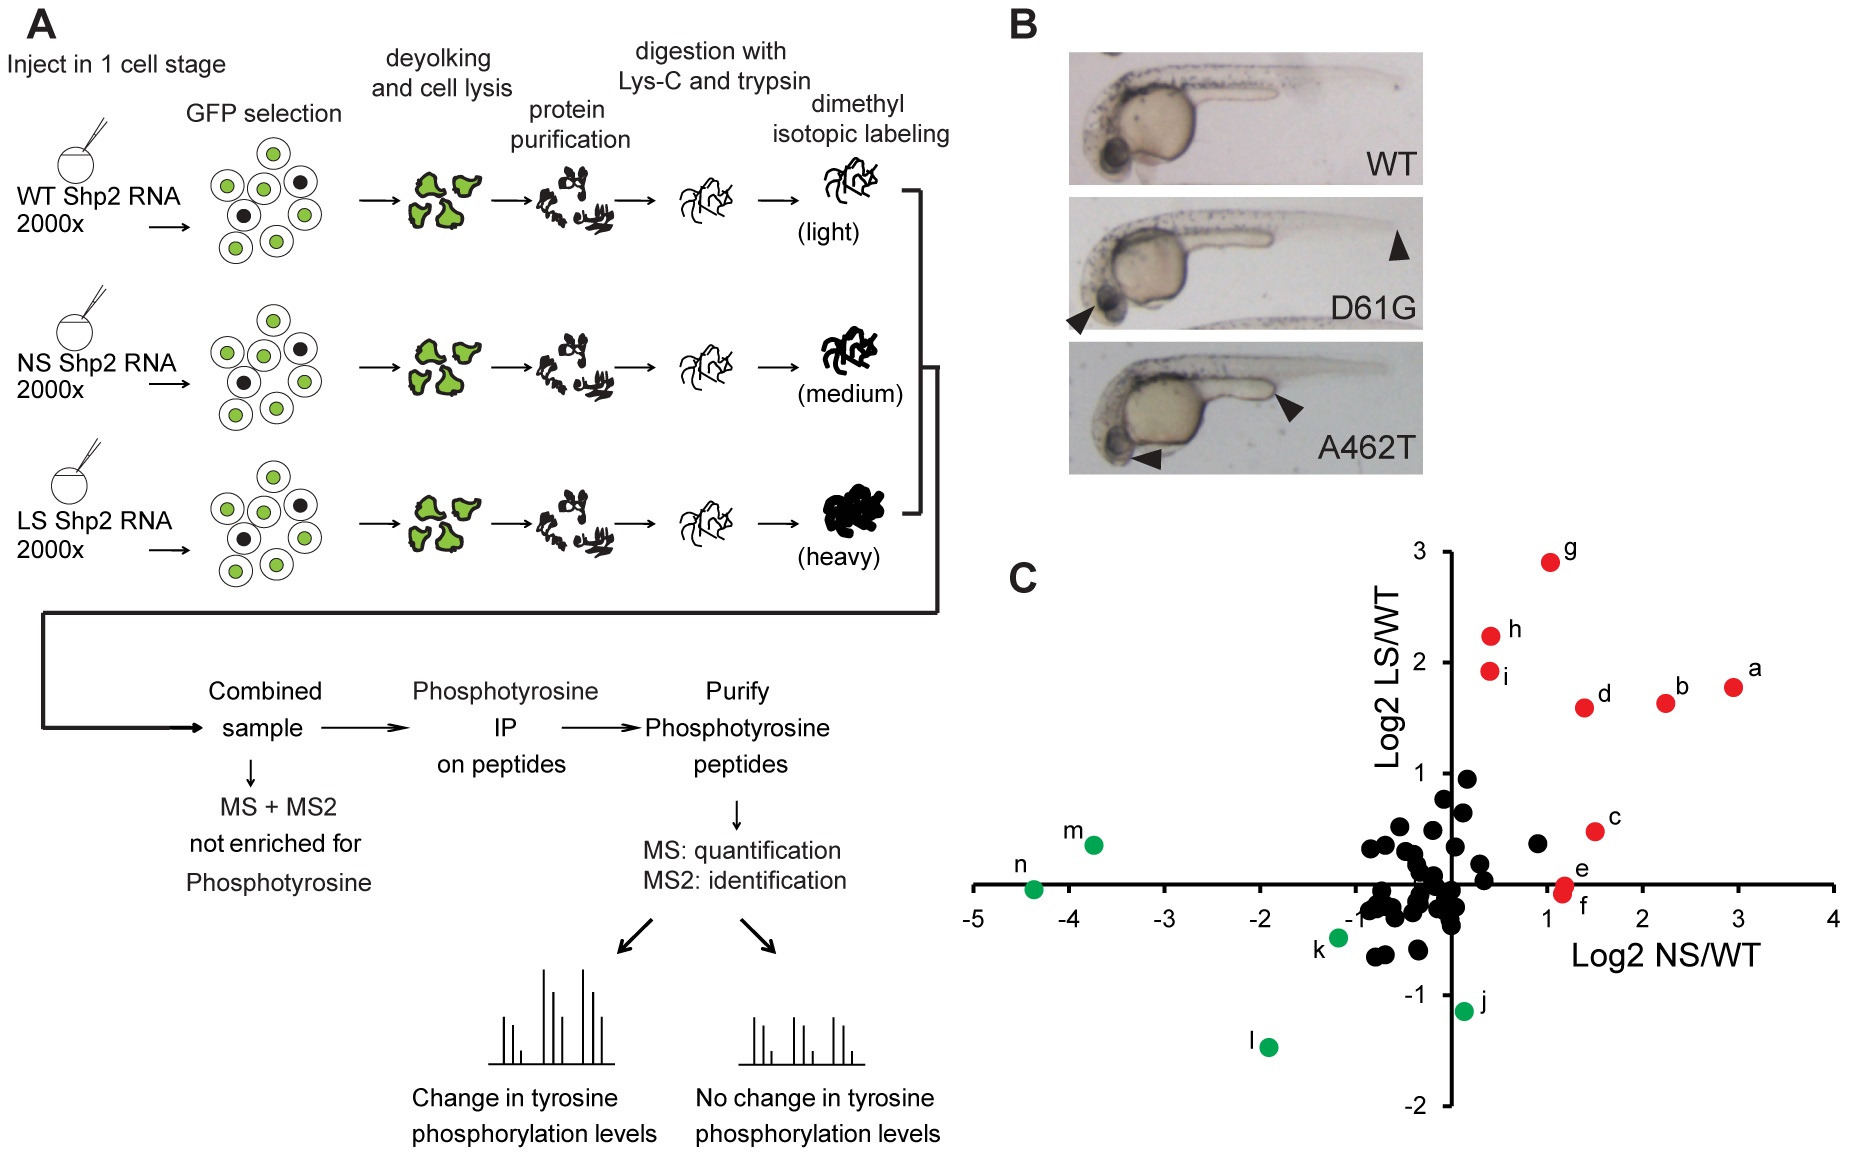
Fig. 1
Comparative pTyr mass spectrometry on 1 day old zebrafish embryos expressing wild type, NS (D61G) or LS (A462T) Shp2. A. Work flow depicting the mass spectrometry approach. Approximately 2000 zebrafish embryos per condition were injected at the 1-cell stage and sorted for GFP expression. Embryos were lysed, trypsinised and labeled using the dimethyl labeling method. WT, NS and LS samples were combined and immunoprecipitated using pTyr specific antibodies. Immunoprecipitate was subjected to MS and peptides were identified and quantified based on MS2 and MS1 spectra, respectively. B. 1 dpf zebrafish embryos expressing WT, D61G and A462T Shp2. Body axis length, craniofacial defects and heart edema in D61G and A462T Shp2 expressing zebrafish are indicated with arrowheads. C. Normalized plot of quantified phosphopeptides Log2 ratios. Peptide ratios with Log2 ratios >-1 and <1 are indicated in black. Peptides with more that 1× Log2 difference are annotated with a-n (see Table 1 for reference). Peptides changed with Log2 ratios <-1 in either NS or LS are indicated in green and Log2 ratios >1 in either NS or LS are indicated in red. See text for further details.