
|
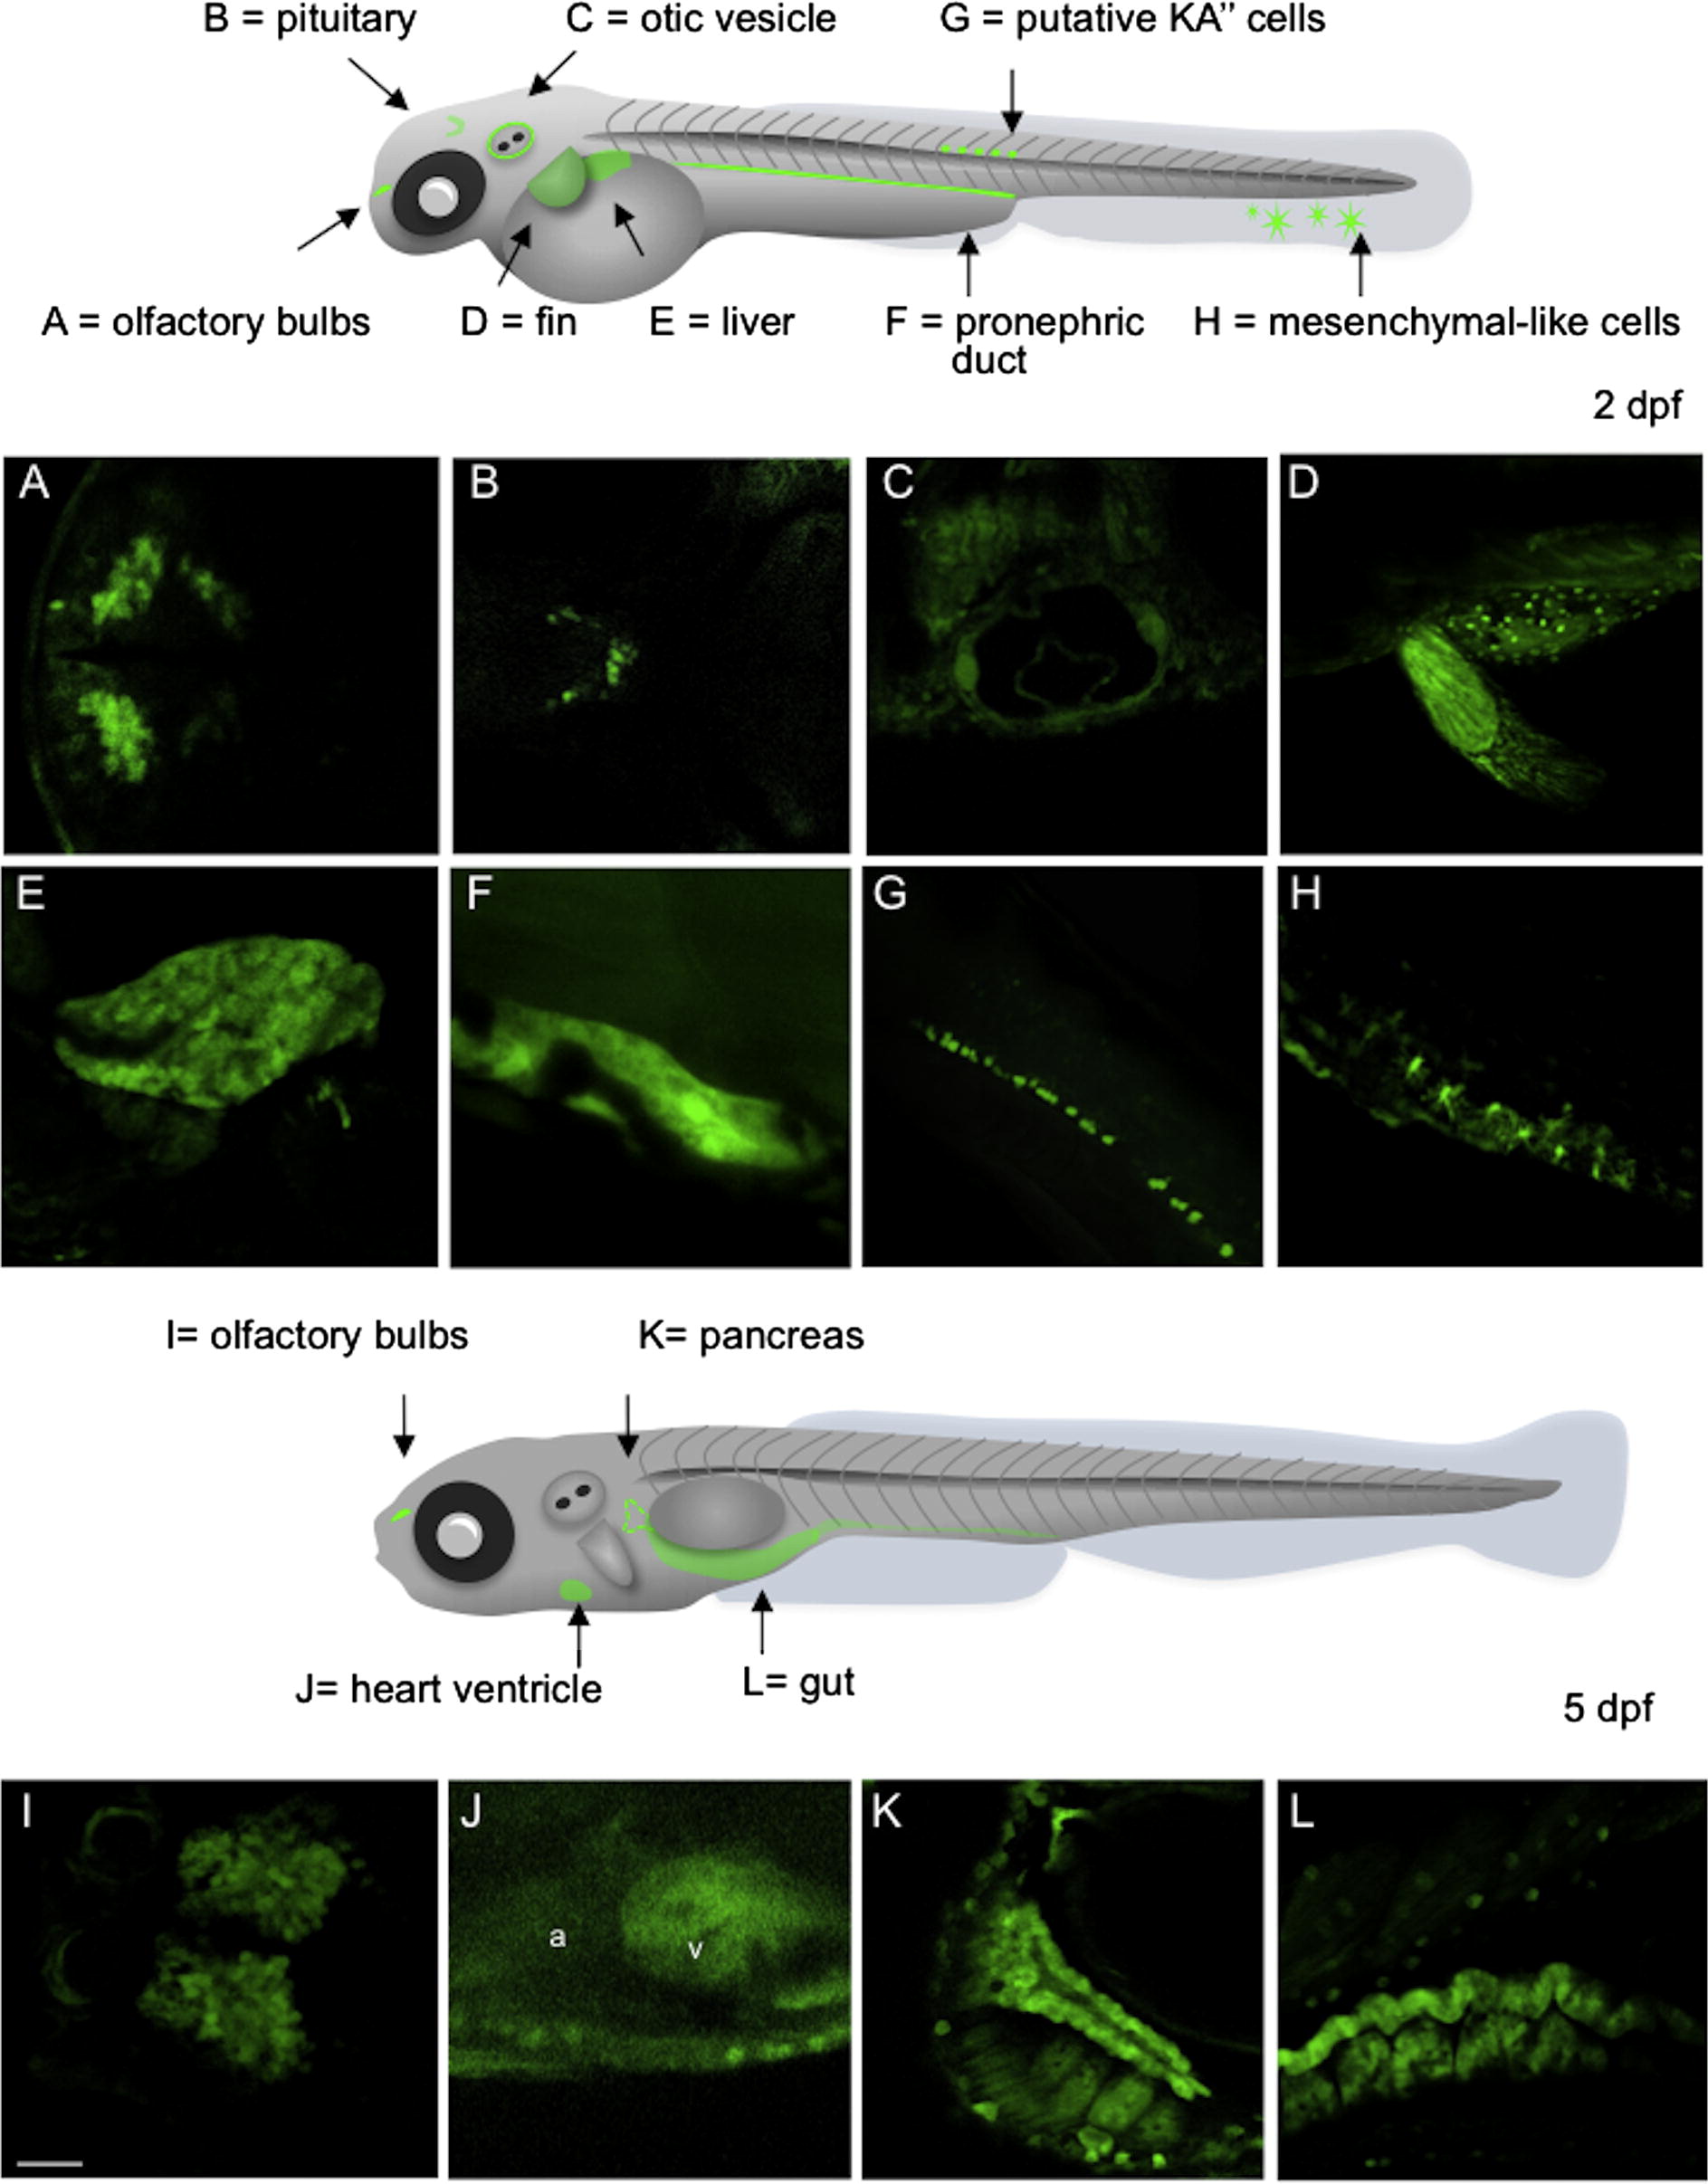
Fig. 2
Reporter expression in untreated 2- and 5-dpf transgenic zebrafish (transgenic males crossed with WT females). Top panel: schematic representation of a 2-dpf embryo indicating the EGFP positive cells and tissues. Below: 20× confocal microscopy pictures showing EGFP in olfactory bulbs and tracts (A, dorsal view), pituitary (B, dorsal view), otic vesicle (C, lateral view), pectoral fin (D, dorsal view), liver (E, lateral view), pronephros (F, lateral view), putative KA′′ cells (G, lateral view) and dermal mesenchymal-like cells (H, lateral view). Bottom panel: schematic representation of a 5-dpf larva indicating the newly detectable EGFP-positive districts in addition to those already revealed at 2 dpf. Below: 20× confocal images showing fluorescence in the olfactory bulbs (I, dorsal view), heart (J, lateral view), pancreas (K, lateral view) and gut (L, lateral view). Scale bar: 200 µM.
Reprinted from Molecular and Cellular Endocrinology, 392(1-2), Benato, F., Colletti, E., Skobo, T., Moro, E., Colombo, L., Argenton, F., Dalla Valle, L., A living biosensor model to dynamically trace glucocorticoid transcriptional activity during development and adult life in zebrafish, 60-72, Copyright (2014) with permission from Elsevier. Full text @ Mol. Cell. Endocrinol.