
|
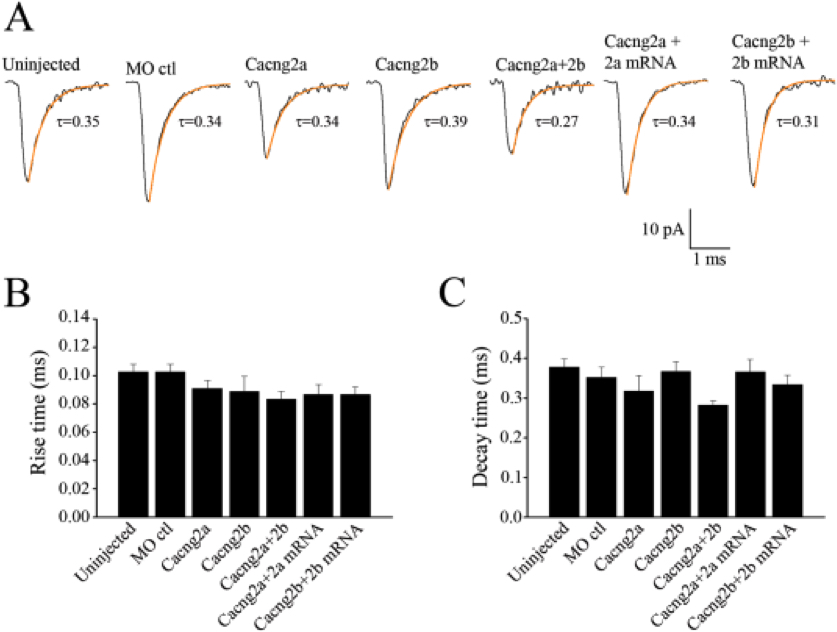
Fig. 9 AMPA mEPSC kinetics. (A) Averaged mEPSCs fit with a single exponent over the decay phase (highlighted by the orange fit). For the uninjected control, 180 events were averaged, for the MO control 248 events were averaged, for the Cacng2a morphants 158 events were averaged, for the Cacng2b morphants 129 events were averaged, for the Cacng2a+2b morphants, 76 events were averaged, for the Cacng2a MO + Cacng2a mRNA injected embryos, 164 events were averaged and for the Cacng2b MO + Cacng2b mRNA injected embryos, 132 events were averaged. Bar graphs comparing the 20–80% Rise times of the mEPSCs (B), and the decay time constants of the mEPSCs (C).