
|
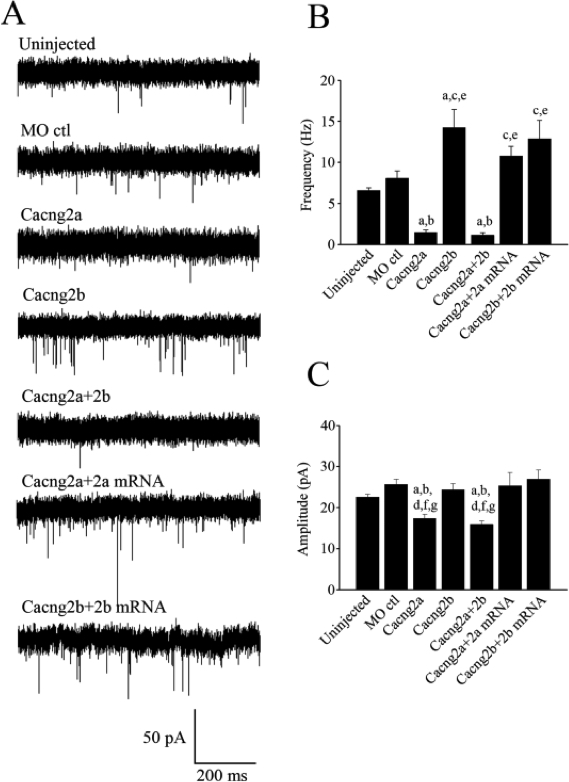
Fig. 6 Spontaneous synaptic AMPAR currents obtained from Mcells. (A) Uninjected embryos (n=6), control MO (4 ng) injected embryos (n=5), Cacng2a MO (4 ng), Cacng2b MO (4 ng) and Cacng2a+2b MO (2 ng+2 ng) injected embryos (n=5), Cacng2a MO (4 ng)+250 pg Cacng2a mRNA (n=5) and Cacng2b MO (4 ng)+250 pg Cacng2b mRNA injected embryos (n=3) exhibit AMPAR currents. The inclusion of NBQX (0.1 μM) confirmed the mEPSCs as AMPAR-mediated (data not shown). Preparations were incubated in TTX (1 μM), strychnine (5 μM), picrotoxin (100 μM) and APV (50 μM) to block action potentials, glycine, GABA and NMDA receptors respectively. (B) Bar graph comparing the mean frequency of mEPSCs. (C) Bar graph comparing the mean mEPSC amplitudes of events obtained from each of the 5 different groups. aSignificantly different from uninjected controls (p < 0.01). bSignificantly different from morpholino controls (p < 0.05). cSignificantly different from Cacng2a (p<0.05). dSignificantly different from Cacng2b (p<0.05). eSignificantly different from Cacng2a+2b morphants (p<0.001). fSignificantly different from Cacng2a+2a mRNA (p<0.001). gSignificantly different from Cacng2b+2b mRNA (p<0.001).