
Image
|
Figure Caption
Fig. 5
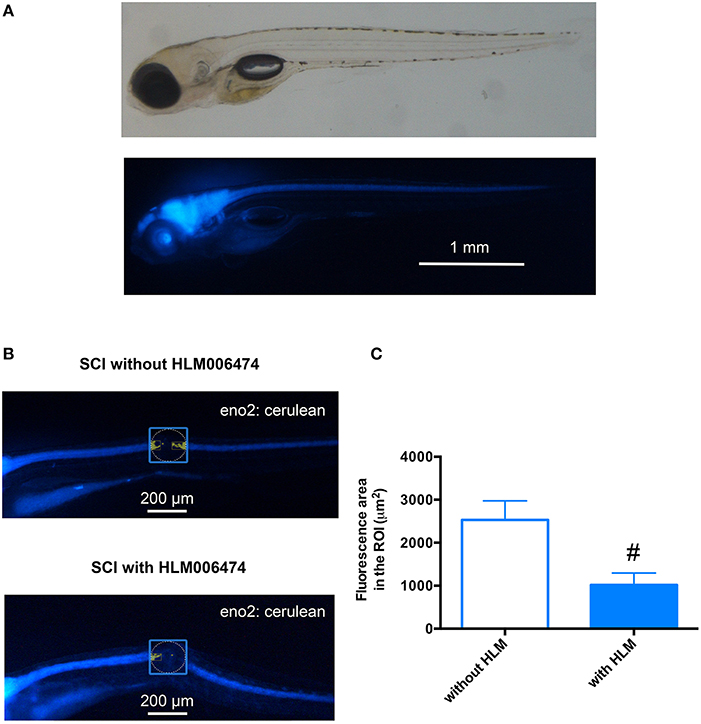
Neuronal regeneration after SCI was impaired in zebrafish treated with E2F4 inhibitor. (A) Representative in vivo imaging of Tg(eno2: Cerulean) zebrafish. (B) Representative in vivo imaging of Tg(eno2: Cerulean) zebrafish with SCI at 3 dpi treated with or without HLM006474. (C) The Cerulean area in the ROI was quantified and compared between zebrafish with SCI treated with or without HLM006474. N = 24 and 22 for zebrafish without and with HLM006474, respectively. #p < 0.05 compared to SCI without HLM006474.
Acknowledgments
This image is the copyrighted work of the attributed author or publisher, and
ZFIN has permission only to display this image to its users.
Additional permissions should be obtained from the applicable author or publisher of the image.
Full text @ Front Pharmacol