
|
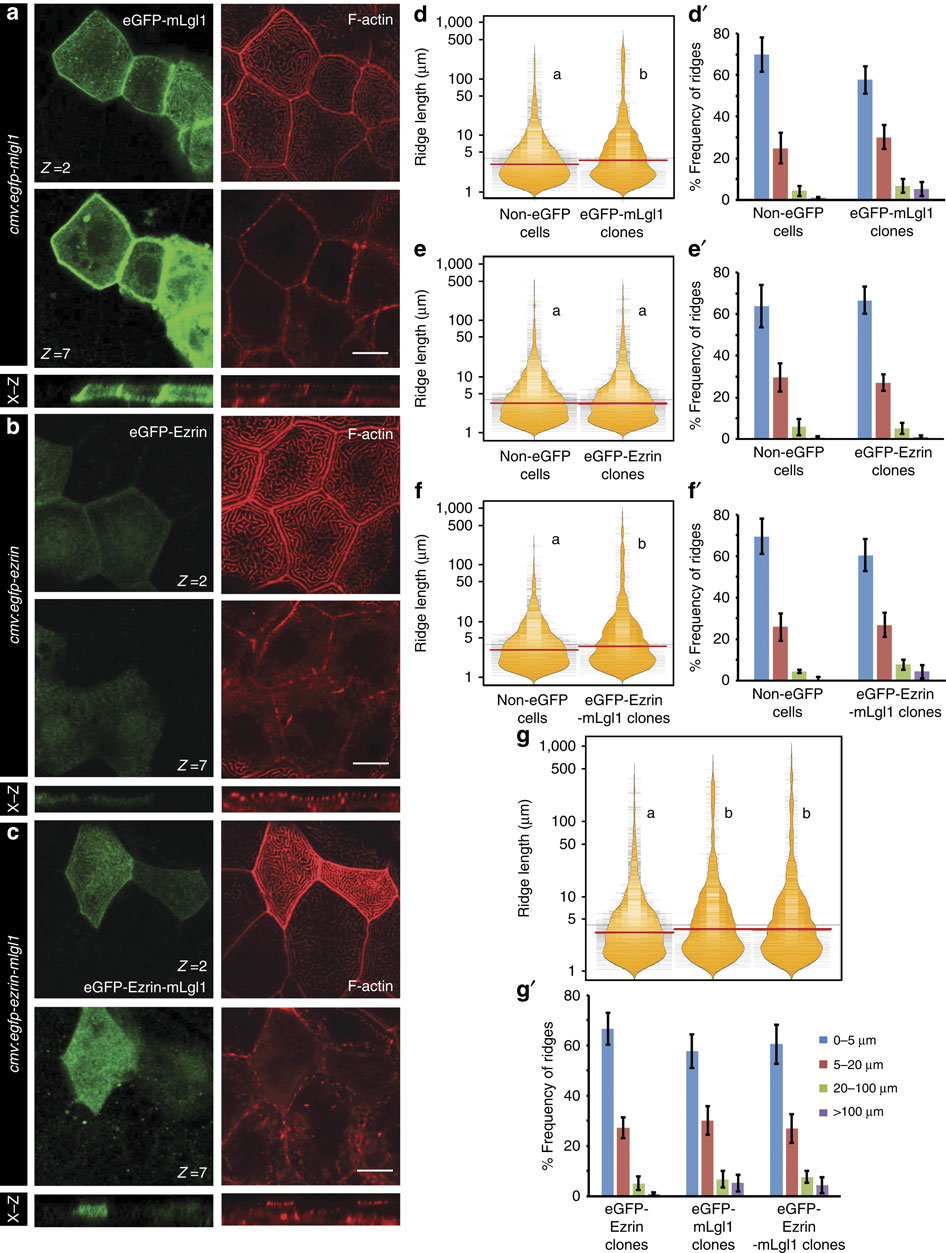
Fig. 6
Apically localized Lgl promotes an increase in the microridge length. Confocal sections at the apical (z=2) and basolateral level (z=7) of the peridermal cells stained (a-c) for GFP and F-actin at 30 hpf in wild-type embryos injected with eGFP-mLgl1 (a) eGFP-Ezrin (b) and eGFP-Ezrin-mLgl1 (c) under CMV promoter along with their corresponding orthogonal sections. Visualization of the distribution of ridge lengths and medians-estimated from clones expressing eGFP-mLgl1 (d) eGFP-Ezrin (e) and eGFP-Ezrin-mLgl1 (f) and their corresponding non-GFP controls using bean plots. Comparison between the ridge lengths exhibited by clones expressing eGFP-Ezrin, eGFP-mLgl1 and eGFP-Ezrin-mLgl1 (g). The frequency distribution of ridges in short (0-5 µm), intermediate (5-20 µm), long (20-100 µm) and very long (>100 µm) categories for clones expressing eGFP-mLgl1 (d′), eGFP-Ezrin (e′) and eGFP-Ezrin-mLgl1 (f′) along with their corresponding non-GFP controls. The comparison between frequency distributions observed in clones expressing eGFP-Ezrin, eGFP-mLgl1 and eGFP-Ezrin-mLgl1 (g′). Quantifications in (d-g) and (d′-g′) are based on phalloidin stainings performed at 30 hpf in the embryos injected with the above mentioned eGFP constructs. Note the minimal localization of eGFP-Ezrin-mLgl1 and eGFP Ezrin to the basolateral cortex as compared with eGFP-Lgl1. The distributions represented by two different alphabets in d-g show significant difference at P<0.05 (Dunn’s multiple comparisons test). Error bars in (d′-g′) represent the s.d. Scale bars in a-c correspond to 10 µm.