
|
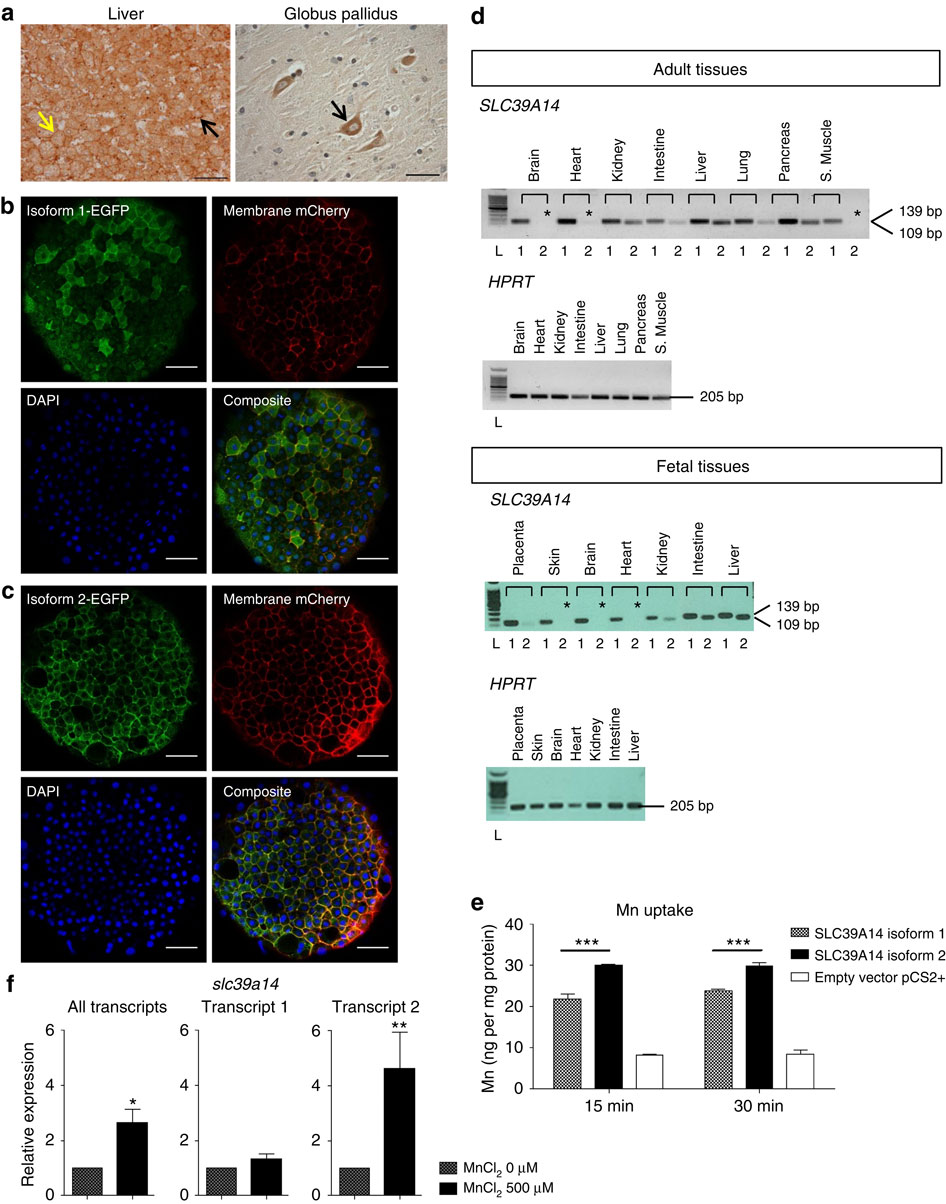
Fig. 3
SLC39A14 isoforms 1 and 2 show differences in tissue expression, Mn uptake and transcriptional regulation. (a) Immunostaining for SLC39A14 (all isoforms) in healthy control liver shows cell membrane expression (yellow arrow) and punctate cytoplasmic staining (black arrow); scale bar, 50µm; Abcam anti-SLC39A14 antibody (ab106568, 1:100); and in globus pallidus (GP) from a healthy control shows positively stained large neurons (black arrow); scale bar, 100 µm; Novus anti-SLC39A14 antibody (NBP1-81551, 1:1,000). (b,c) Confocal images demonstrating the subcellular localization of fluorescently tagged human SLC39A14 isoform 1 (b) and isoform 2 (c) expressed in zebrafish embryos. Immunostaining for EGFP and mCherry at 6 hpf shows that both isoforms are expressed at the cell membrane (co-localization with membrane mCherry) and in the cytoplasm. 4′,6-diamidino-2-phenylindole (DAPI) was used as a nuclear stain. Scale bar, 50µm. (d) RT-PCR of adult and fetal human tissues showing differences in mRNA expression between isoform 1 (ubiquitous expression in the tissues examined) and isoform 2 (* absent expression in brain, heart, skeletal muscle and skin). Amplicons for isoform 1 and 2 span 139 bp and 109 bp, respectively. Hypoxanthine-guanine phosphoribosyltransferase (HPRT) was used as a housekeeping gene. L, 100 bp ladder (Promega). (e) Graph showing Mn uptake in HEK-293 cells transiently transfected with wild-type SLC39A14 isoform 1 and 2, and empty pCS2+ vector following 15 and 30 min of MnCl2 (1 µM) exposure. Both isoforms facilitate Mn uptake. Cells transfected with isoform 2 have significantly higher Mn levels (P=0.009). Data are presented as means±s.d. from two independent experiments. Statistical analysis was performed using one-way ANOVA (P=0.0002 (15 min), P=0.0002 (30 min)) and Tukey’s multiple comparison test (***P<0.001). (f) Graph showing slc39a14 transcript levels assessed by qRT-PCR in 5 dpf zebrafish larvae after exposure to 500 µM MnCl2 for 24 h. Overall transcript levels are increased (P=0.035). Transcript levels of isoform 1 are unchanged (P=0.41) while those of isoform 2 show a 4.6-fold increase (P=0.005). Data are presented as means±s.d. from three independent experiments. Statistical analysis was performed using Student’s two-tailed t-test on individual ΔCt values (*P<0.05, **P<0.01). ANOVA, analysis of variance.