
|
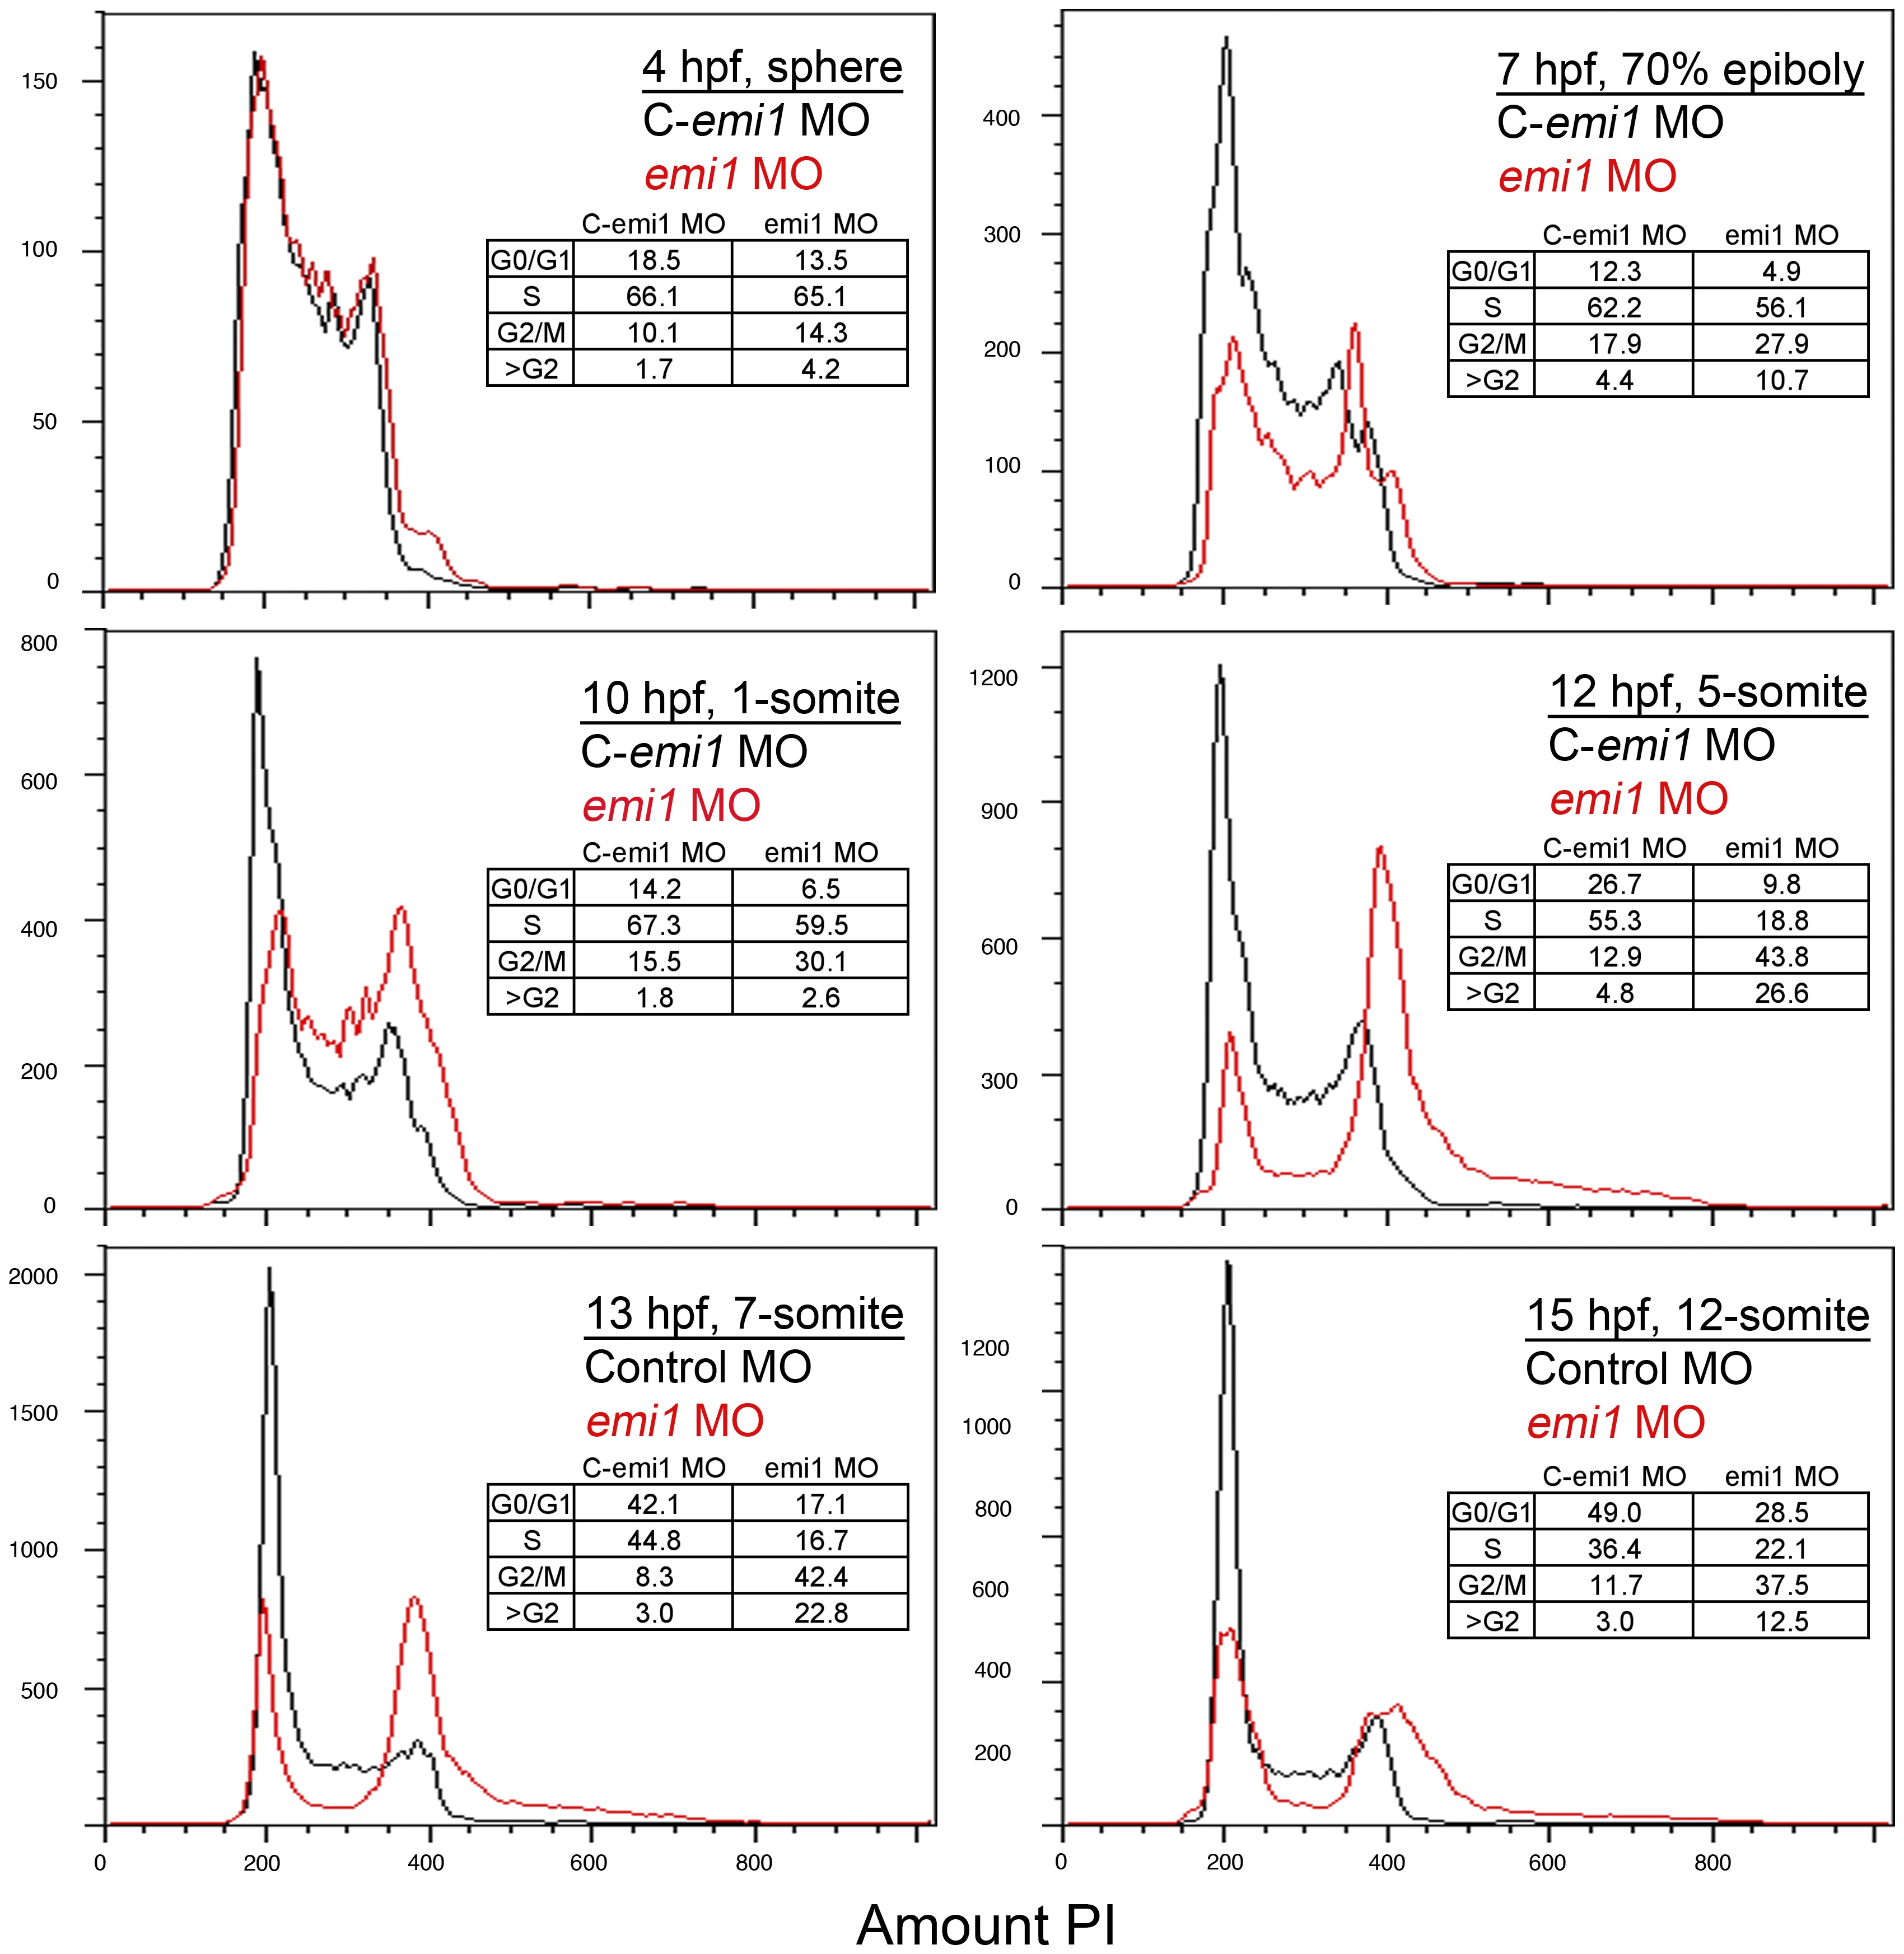
Fig. 1
Developmental time course of emi1 morphant cell cycle defects.
FACS scanning of propidium iodide (PI)-stained total cells from embryos injected with control (C, in black) or emi1-specific morpholinos (in red) (2 ng per embryo). Each panel shows an overlay of the distribution of control and emi1-morphant cells. Age and developmental stage of embryos is indicated. The insert shows the percent of cells with 2 n DNA content (G0/G1), cells replicating their DNA (S), cells with 4 n DNA content (G2/M) and cells with greater than 4 n DNA content. The percent of cells in each stage has been estimated with the Watson mathematical model in Flowjo software, except for the 4 hpf and 7 hpf time points for each we have assigned the gates for each cell cycle stage.