
|
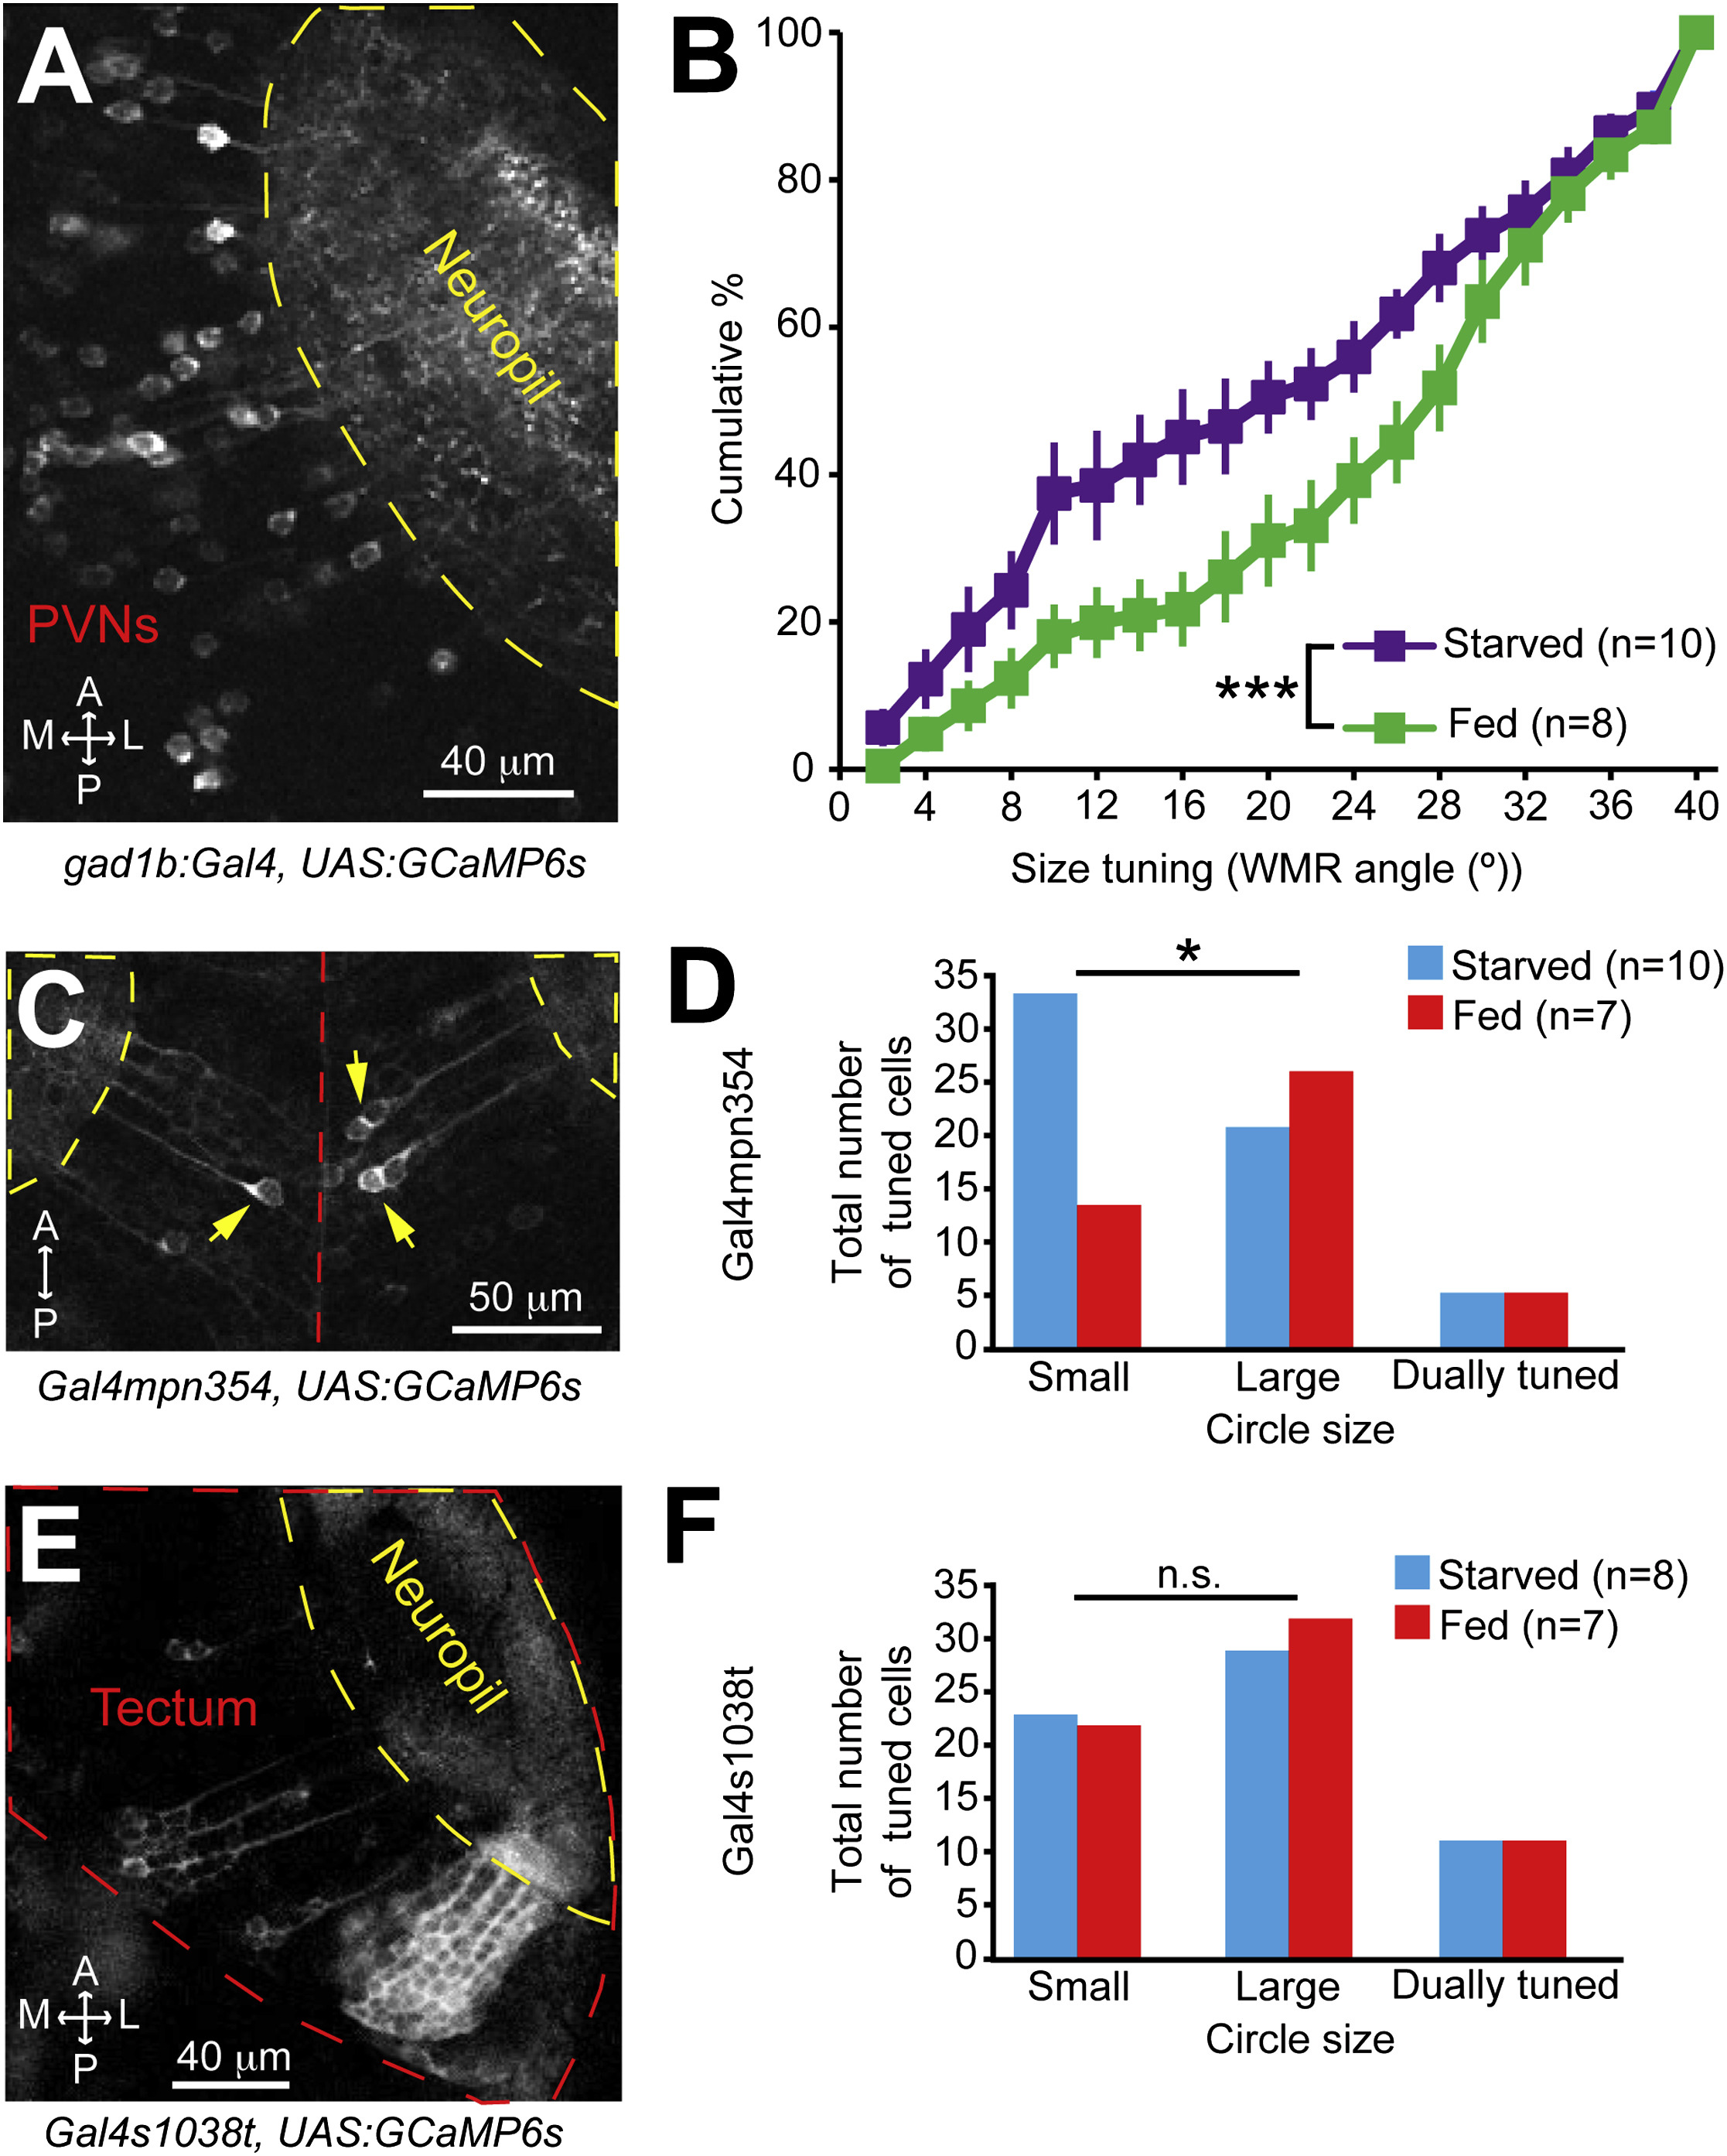
Fig. 6
Feeding State Affects the Activity of Specific Populations of Neurons in the Tectum
(A) Two-photon image showing GABAergic neurons in the tectum of a 7 dpf gad1b:Gal4, UAS:GCaMP6s larva.
(B) Graph comparing cumulative percentages of WMR angles for tectal GABAergic neurons in starved and fed 7 dpf gad1b:Gal4, UAS:GCaMP6s larvae. ***p = 3.9E-5, two-sample Kolmogorov-Smirnov test. Data are presented as mean ± SEM.
(C) Two-photon image showing part of the tectum of a 6 dpf Gal4mpn354, UAS:GCaMP6s larva. The red and yellow dashed lines mark the brain midline and tectal neuropils, respectively.
(D) Graph showing numbers of Gal4mpn354 cells tuned to small (≤10°) or large (≥20°) visual stimuli. Dually tuned neurons responded to both small and large stimuli. Examples of the three types of responses are shown in Figure S3. *p = 0.02, Fisher’s exact test.
(E) Two-photon image showing part of the tectum of a 7 dpf Gal4s1038t, UAS:GCaMP6s larva.
(F) Plot showing numbers of Gal4s1038t neurons tuned to visual stimuli of different sizes in starved and fed animals. n.s., not significant, Fisher’s exact test.
A, anterior; L, lateral; M, medial; P, posterior; PVN, peri-ventricular neuron.
See also Figure S3.