
|
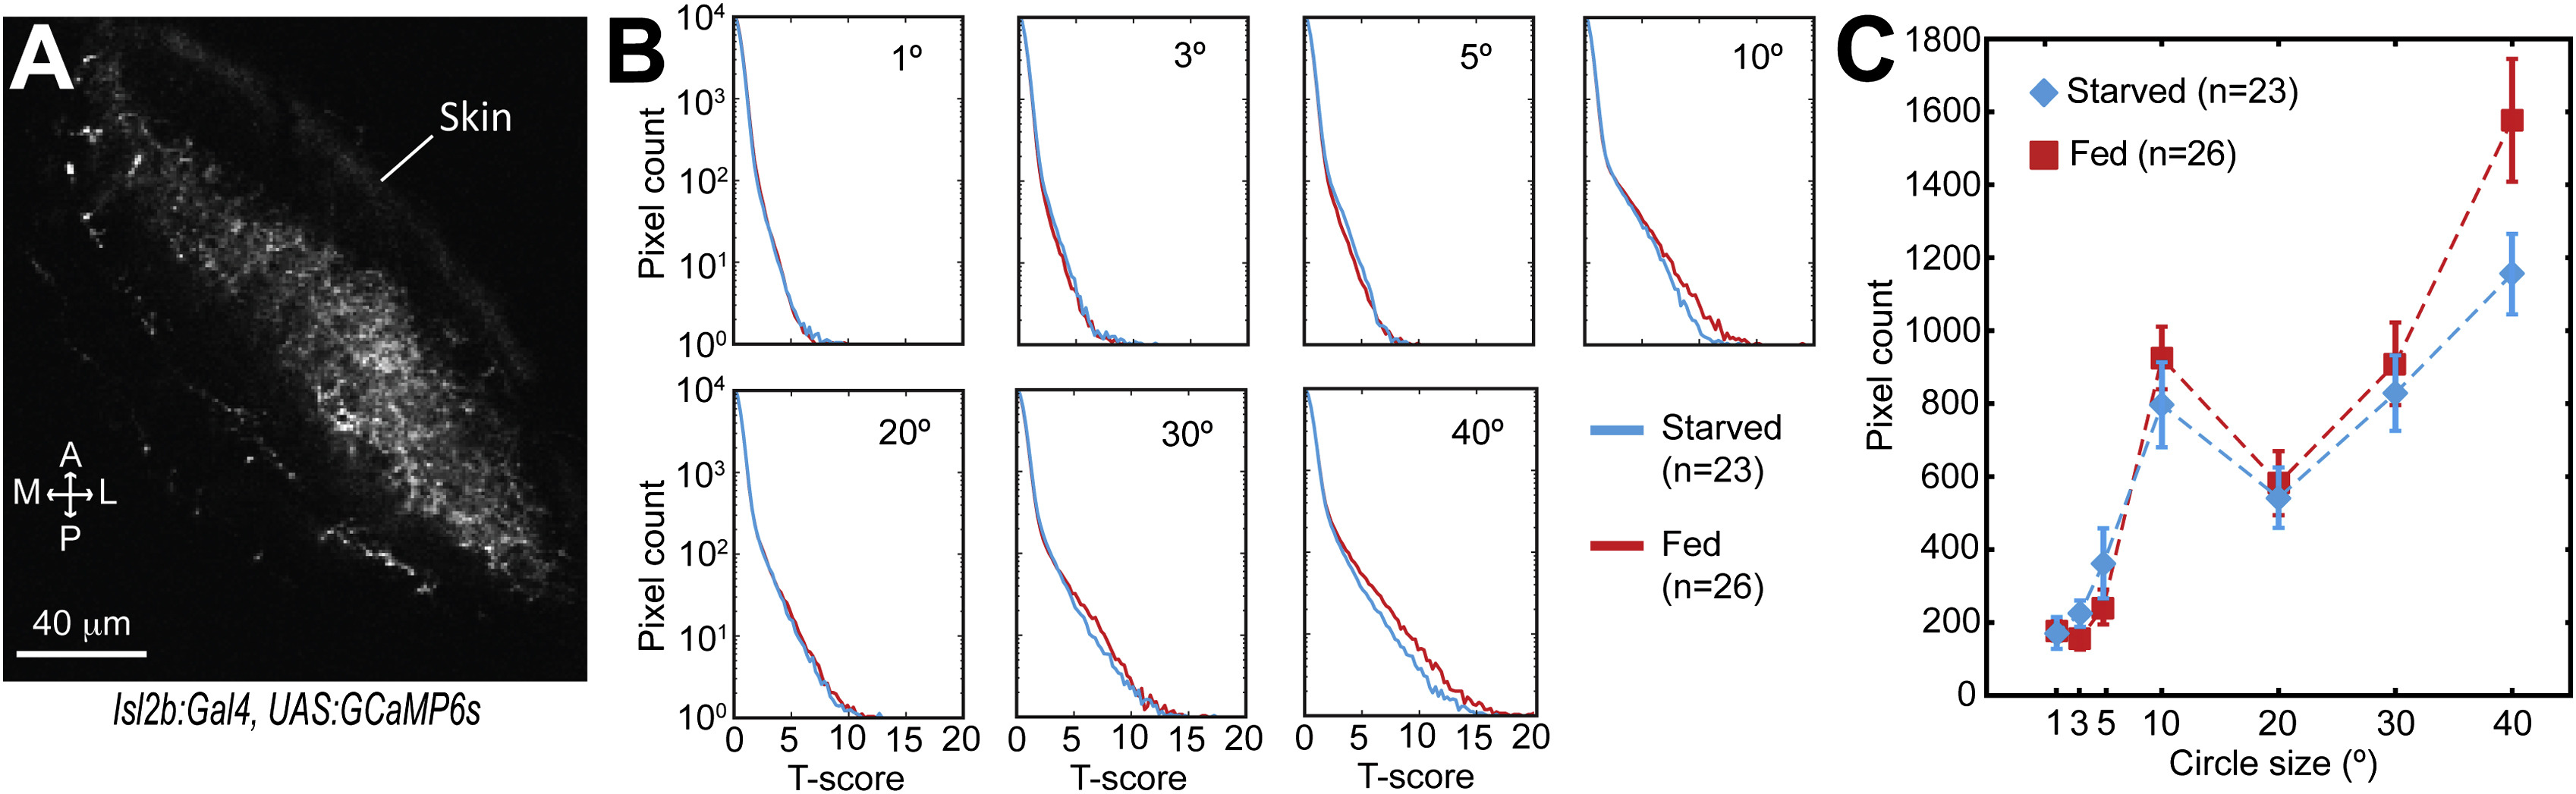
Fig. 5
The Influence of Feeding State Is Not Detectable in RGC Axons in the Tectal Neuropil
(A) Two-photon image of the tectal neuropil of a 7 dpf Isl2b:Gal4, UAS:GCaMP6s larva showing RGC axons. A, anterior; L, lateral; M, medial; P, posterior.
(B) Average distributions of the T scores obtained from the pixel-wise analysis of the activity of RGC axons, in response to visual stimuli of different sizes (in degrees of visual angle) in fed or starved 7 dpf Isl2b:Gal4, UAS:GCaMP6s larvae. The procedure for calculating the T scores is summarized in Figure S2.
(C) Average numbers of pixels active in response to visual stimuli of different sizes. Background noise was removed by subtraction of a component related to image time series obtained in the absence of visual stimulation (see Experimental Procedures for details). Error bars represent SEM. No statistically significant differences were detected between fed and starved animals (t test with Benjamini-Hochberg correction). n = number of trials.
See also Figure S2.