
Image
|
Figure Caption
Fig. S9
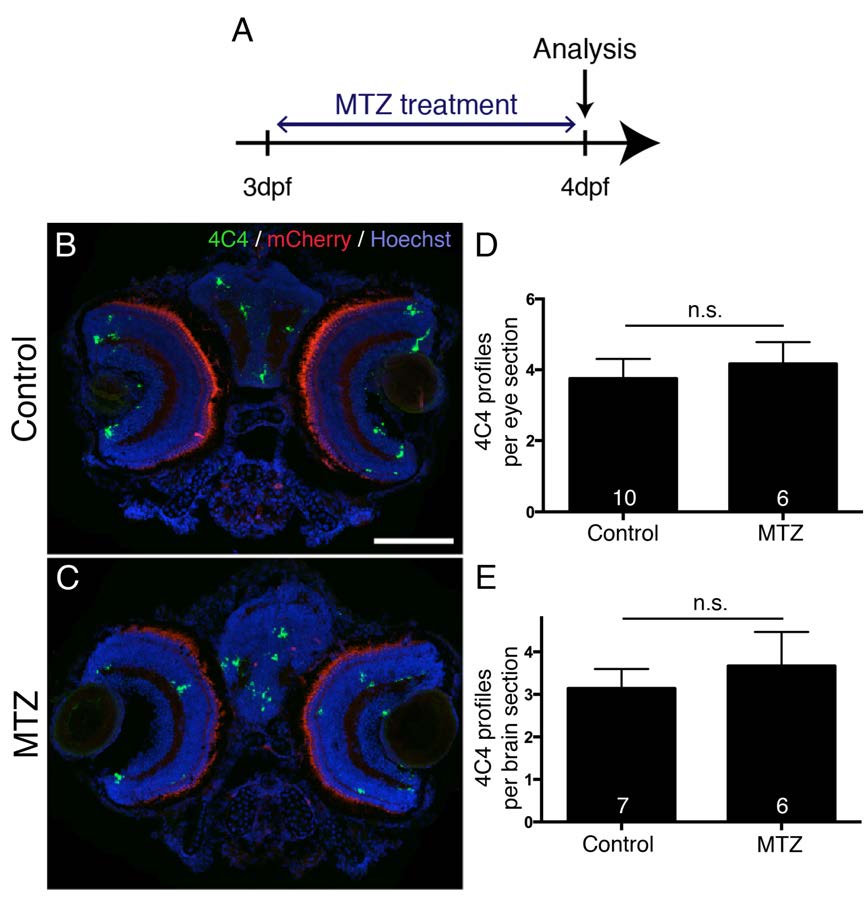
MTZ treatment does not lead to increased microglia/macrophage labeling in brain and eye. A: The experimental time line is shown. B-E: In cross sections (dorsal is up) through the head of MTZ treated Tg(mnx1:Gal4, UAS:nfsB-mCherry) larvae, the number of microglia/macrophage profiles in the eyes (D) and brain (E) are not different from control treated larvae (Mann- Whitney U-test, p > 0.05). Photoreceptors show non-specific fluorescence in the red channel. Scale bar in B = 100 µm for B,C.
Acknowledgments
This image is the copyrighted work of the attributed author or publisher, and
ZFIN has permission only to display this image to its users.
Additional permissions should be obtained from the applicable author or publisher of the image.
Full text @ Development